"addAxis"
Adds an axis.
Synopsis
int shape.addAxis(float min, float max, string label);
Parameters
| Parameter | Description |
|---|---|
| min | minimum value |
| max | maximum value |
| label | label of the axis |
Return Value
The function returns the axis number for the created axis.
Description
Adds an axis. This function has to be used in the charttype Radar to create a chart.
Furthermore, this function can be used in other charttypes, for example Bars. Here it is not necessary to add axes, because this chart type does this automatically. If this function is used after all, simply the value range is fixed and a label of the axes is added.
You can add a third axis in a bubble chart, which defines the minimum and maximum item values being shown. Items outside of this range will not be visible. When a series is shown as line, all items will be shown.
![]() Example
Example
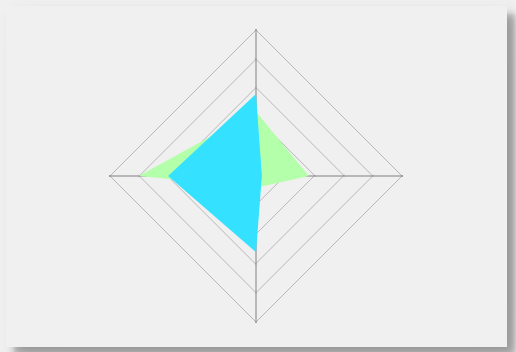
In the following example a chart of the type Radar is created. Four axes without a label were added.
main()
{
   dyn_float one;
   one[1] = 9;
   one[2] = 11;
   one[3] = 20;
   one[4] = 2;
   this.addSeries(one);
   this.setSeriesFillColor(0, "{180,255,170}");
   dyn_float two;
   two[1] = 1;
   two[2] = 14;
   two[3] = 15;
   two[4] = 13;
   this.addSeries(two);
   this.setSeriesFillColor(1, "{52,225,255}");

   this.setSeriesName(1, "Blue");
   this.setSeriesName(0, "Green");

   this.addAxis(0, 25, "");
   this.addAxis(0, 25, "");
   this.addAxis(0, 25, "");
   this.addAxis(0, 25, "");
}