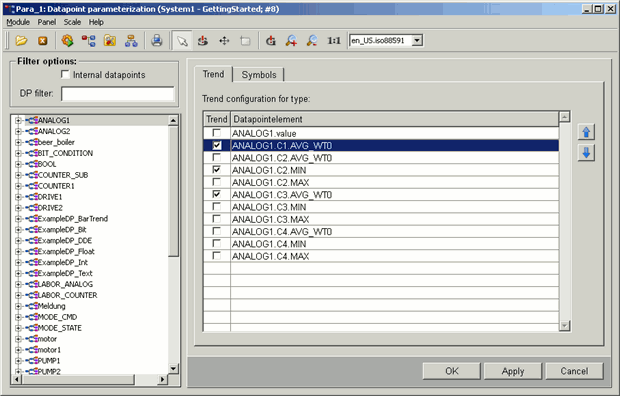
DPE selection for the trend configuration
With a click on a data point type in the PARA tree two tabs are displayed in the panel field - Trend and Symbols.
The Trend tab allows the selection of data point elements, whose curves should be later displayed in the variable trend. This enhancement is used for:
-
easy and fast creation of a trend view with specific data point elements
-
creation of a consistent trend view for all data points of a type
-
displaying of specific object library's data point elements in the trend when the standard object library is used. These curves are used in the trend panel of a faceplate (e.g. _VarTrend_STDLIB_general), if the Standard Object Library is installed or an object library is available.
These settings are not available in a distributed system.
Tick the specific check boxes next to the data point elements and confirm the configuration by clicking on Apply or OK. Note that max. 16 curves can be displayed in a variable trend.

Alternatively you can enter the following code example in order to display the curves in a variable trend:
string sDp = "myDataPoint."; //name of the data point
string sDpt = dpTypeName(sDp);
dyn_string dsDptTrendCurves;
dyn_string dsDollarTrendCurves;
if (sDp[strlen(sDp)-1] == ".")
sDp = substr(sDp,0, strlen(sDp)-1);
if (dpExists("_ds_"+sDpt+".trendElements"))
dpGet("_ds_"+sDpt+".trendElements" , dsDptTrendCurves);
for (int i = 1; i<=dynlen(dsDptTrendCurves); i++)
{
  string sTemp = dsDptTrendCurves[i];
  strreplace(sTemp, sDpt, sDp);
  dsDollarTrendCurves[i] = "$CURVE"+i+":"+sTemp;
}
openTrendCurves("_VarTrend_STDLIB_general", -1, dsDollarTrendCurves);
The trend view “_VarTrend_STDLIB_general” can be configured in the variable trend properties (e.g. curves style, scale changes) - see Variable Trend configuration.


