Monitoring of managers
If the Pmon is started without arguments the project is started immediately. This means that all managers are started in the defined sequence whereas the next manager is started first when the last manager has the state "running". To speed up the start process the value archives are started parallel.
If a manager should stop during the project start the Pmon tries to restart it (the number of the start tries can be set via the "Restart" option - see also Functionality of the Pmon). If the further tries are not successful either the project is started and the stopped manager is ignored (except the Data and Event managers). If a Data or Event manager stops when the project is started the start is canceled and the Pmon switches to WAIT_MODE. In this mode the Pmon only waits for commands per TCP (see also TCP port below).
In redundant error cases the project will be restarted via Pmon and not via the event manager. Starting errors like invalid license will be stopped with PRIO_FATAL or Exit as normally.
If all managers were started successfully the Pmon switches to the MONITOR_MODE. In this mode simply stopped managers are restarted. Note that only managers of registered projects can be started. A project can be registered via the Project Administrator panel.
It has to be considered that only managers with the start option "always" will be monitored.
The console panel shows the status of the single managers if required. The status shown in the console is 0 (stopped), 1 (initialized), 2 (runs) or 3 (blocked). The PID is a numeric process ID.
If a manager is started the stdout and stderr outputs are saved in the
<manager><num>.log file in the log directory.
Special cases
When the WCCILdata stops or when the WCCILevent or WCCOAvalarch stops in a redundant
system, the whole project is restarted (RESTART_MODE). If a stopped/blocked manager
is detected a possibly existing script in the directory <wincc_oa_path>/bin with the name
crashAction and the extension .sh (for Linux)
or .cmd (for Windows) is started. Thereby different arguments are
passed:
- <Type>
- <Manager name>
- <Command line options>
- <Process ID>
The following settings are valid for <Type>:
- RESTART_ALL: If Event/Data/Valarch stops like above
- RESTART_THIS: If a single or another manager stops
- NO_RESTART_ANY_MORE: If a manager stops too fast (more often than Restart# during ResetMin). These settings are defined in the progs file, see also Functionality of the Pmon).
- DELAYING_RESTART : If the config entry
restartDelaySeconds
                        >0
is set, this type will be passed instead of "NO_RESTART_ANY_MORE". - BLOCKED: If a manager whose alive status has not changed for too long is found.
- EMERGENCY_MODE: Is called if the system (Data manager) switches to emergency mode. This means that managers are not started because the system switched to the emergency mode.
- STARTUP_TIMEOUT: If the timeout that was set for the project via the
config entry
startupTimeoutSecondselapses, the crashAction script is started.
Example
The following example script crashAction_sample.cmd(from the
WinCC OA installation directory under/bin)sends a
message when a manager is not stopped properly:
rem ************************ crashAction.cmd **************************
rem * this script is called by WinCC OA Console on WinCC OA manager crash
rem * with following parameters:
rem * %1 <next_action>: one of:
rem * NO_RESTART/RESTART_ALL/RESTART_THIS/NO_RESTART_ANY_MORE/EMERGENCY_MODE
rem * %2 <manager>
rem * %3 <manager parameter> ...
rem *******************************************************************
net send %computername% WinCC OA manager crashed:" %1 %2 %3 %4 %5 %6 %7 %8 %9 
For Linux see content of crashAction_sample.sh from the WinCC OA installation directory under /bin.
TCP port
The Pmon opens a TCP server socket with the default port number 4999 at the start. The port number can be changed via the command line option -port nnnn or via the config entry pmonPort in the [general] section.
Via this port the Pmon can be queried and controlled. 3 types of protocols are supported at this port (the recognition is automatic):
- HTTP
- Pmon specific protocol
- SNMP
HTTP
The Pmon sends an HTML page, which shows the status of the project. This page can be shown via a browser and is updated automatically every 5 seconds. The call in the browser looks as follows:
http://localhost:4999
This page also allows to control the project. Single managers or the whole project can be started/stopped (see figure below). Each access always has to be authenticated. The authentication is defined via the command line option -auth of the Pmon. A user name and an encrypted password for the authentication are contained in the progs file.
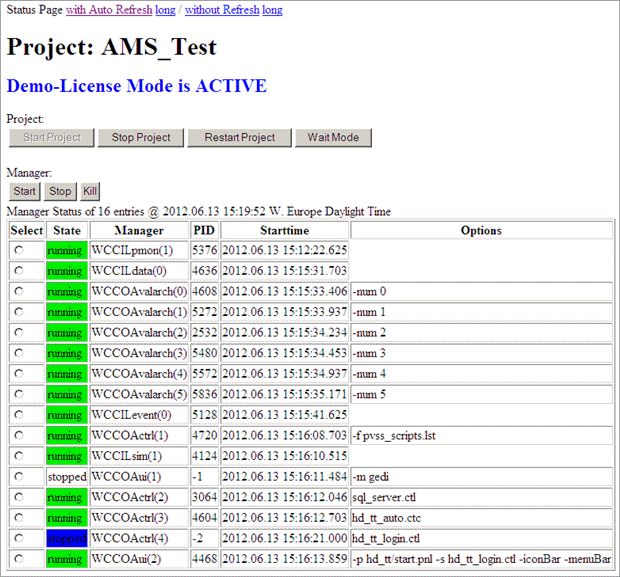
By using the buttons under Project, you can start a project, stop and restart it as well as activate the wait mode. In the WAIT_MODE the PMON only executes explicit commands. This means, for example, that when a manager crashes in this mode, it will not be restarted automatically.
At the top of the page you can select whether the project state should be refreshed automatically or not and whether additional manager information meaning start mode, secs kill, restart count and reset minutes should be shown.
Specific Pmon protocol
Via this protocol the whole PmonTable can be queried or also changed. Specific commands that are sent to the opened port allow to control the project. See chapter Details on the Pmon for more information on available commands.
SNMP
SNMP is a solution for controlling your whole network infrastructure. SNMP is deactivated by default. To activate SNMP use the config entry allowSNMP = "yes" in the [pmon] section of the config file.
Pmon Watchdog
A CTRL script pmonWatchdog.ctl is part of the script list pvss_scripts.lst.
The pmonWatchdog.ctl script monitors the specified managers (defined via config entries) and kills them if they are blocking longer than the specified time (specified via waitUntilKill).
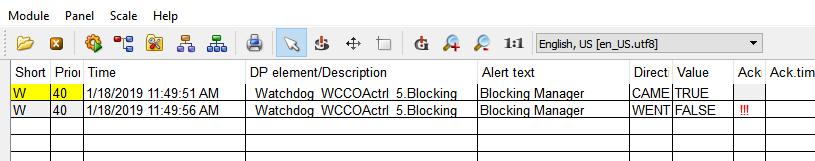
When the Pmon Watchdog is used and a monitored manager blocks, an alert is triggered. The alert is shown in the alert screen. When the manager is stopped is specified via the config entry waitUntilKill (see the description of the config entries below).
If manager numbers are subsequently changed, the script pmonWatchdog.ctl must be restarted. Restart the CTRL Manager 1 with the script -f pvss_scripts.lst in the WinCC OA console.
The config entries have the following syntax and have to be specified in the [pmonWatchdog] section:
| Config Entry | Description |
| waitUntilKill |
The timeout in seconds. The default value for the timeout is 180 seconds. If the value -1 is set, the function is deactivated. |
| monitoredManager |
monitoredManager = "manager name,manager number" manager name: The manager name needs to be specified by using the file name without the file extension, e.g. WCCOActrl, WCCOAiec61580. manager number: The second parameter is the manager number. If no number is specified, all managers of the same type (manager name)are monitored. Monitoring a specific manager including the manager number is only possible if the manager number is specified as a start parameter. This is the number that was used to start the manager in the console. If there are no monitoredManager entries defined, the function is deactivated, even if the timeout is > 0. Example: [pmonWatchdog] waitUntilKill = 300 monitoredManager = "WCCOAvalarch" # Monitor all Archive managers monitoredManager = "WCCOActrl,5" # Only monitor CTRL manager with number 5 If the project / process monitor is password protected the new monitoring function cannot be used due to security reasons. Do not save the password in clear text in the pmonWatchdog.ctl script or in any other part of the WinCC OA configuration files. Only the process monitor on the local machine can be monitored. Establishing a connection to a process monitor running on a remote machine is not possible. |
Debug Flag -dbg wdc
The debug flag -dbg wdc can be used for Watchdog information output into the LogViewer. The debug flag outputs additional information: which manager is monitored, the status of the manager and if a manager is blocked as well as the time when a manager was blocked.


