
Pie Chart Widget
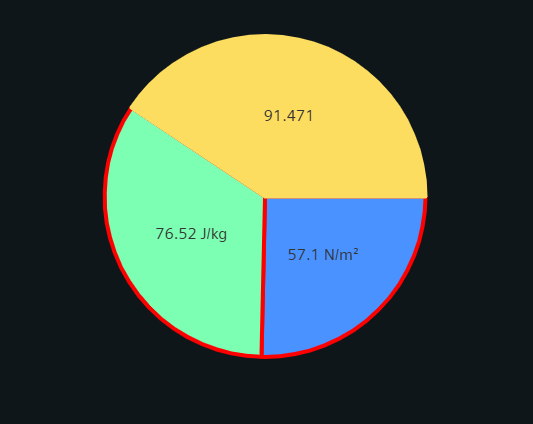
The Pie Chart Widget is used for visualization of data distribution though larger or smaller segments.
Settings
The Pie Chart Widget can have the custom appearance settings of custom title, colors and controls.
Content
The user can add multiple datapoints to the Pie Chart, each as a separate series of values. Names, Descriptions, Units and other values are typically taken from the configurations within the project, but can be overridden here. Multiple Series are placed together in one graph and can be sorted via the arrow buttons in the respective title bar.
Formatting
The legend listing the corresponding datapoint names can be displayed in variable combinations of alignment, position and can be made scrollable for easier handling of larger legend entries.
Labels showing either actual values, percentages or both can be positioned either inside or immediately outside their corresponding chart section.
The Pie chart style can be selected from pie chart, doughnut chart, rounded doughnut chart or half doughnut chart..
Activating the tool tip with the corresponding checkbox will add a tooltip with the datapoint name and current value when hovering over a chart section.
Supported Datatypes
| Datatype | Supported |
|---|---|
| float | ✓ |
| int | ✓ |
| long | ✓ |
| uint | ✓ |
| ulong | ✓ |