
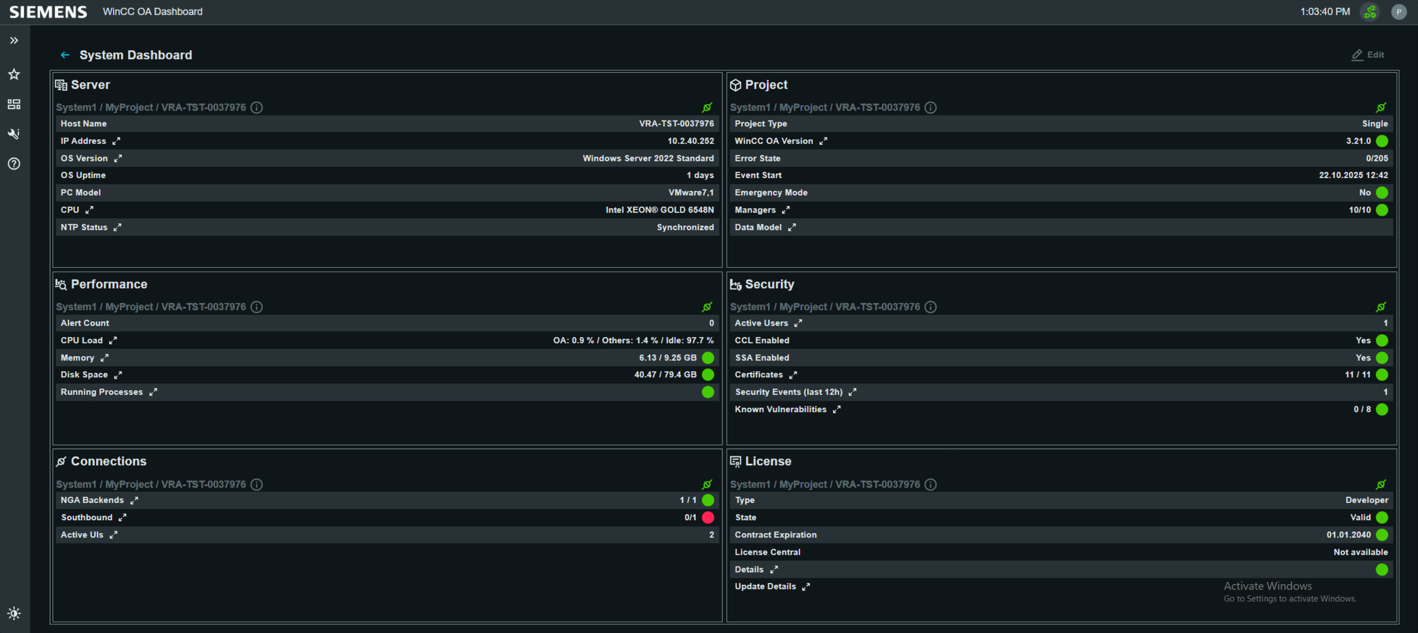
System Dashboard
The System Dashboard in WinCC OA provides a central overview of system status, performance metrics, and security aspects. It helps operators and administrators quickly view and assess important information.
Main Features
- Real-time monitoring of server and system status
- At-a-glance security and licensing info
- Visual KPIs and alerting for fast troubleshooting
- Minimal configuration needed for startup
 The dashboard is included by default in new projects and can be
enabled either automatically during project creation or upgrade, or manually added via
the Node Manager. A dedicated button opens the System Dashboard in your default browser
and displays project-specific content, depending on the project type (e.g., redundancy,
single projects).
The dashboard is included by default in new projects and can be
enabled either automatically during project creation or upgrade, or manually added via
the Node Manager. A dedicated button opens the System Dashboard in your default browser
and displays project-specific content, depending on the project type (e.g., redundancy,
single projects). Functionality and Content
The System Dashboard consists of several widgets that visualize various categories of system metrics:- Server: Displays information on host, operating system, uptime, hardware model, and synchronization status.
- Performance: Shows current load (CPU, RAM, storage), the number of running processes, and performance-related warnings.
- Connections: Indicates backend and interface connectivity as well as the status of active connections.
- Project: Shows project type and version, event status, redundancy information, and other project-specific details.
- Security: Provides user overview, license and certificate status, active security mechanisms, and recent security events.
- License: Displays license status, including validity, type, and expiration date.
Configuration and Extension
The System Dashboard is ready for use immediately after installation and is usually enabled by default in new projects. Access it easily via . If needed, you can manually add or activate the dashboard manager (system-dashboard/index.js) during setup or upgrades—either
automatically with the upgrade checkbox or by specifying it in Manager Properties.
Minimal configuration is required. Ensure the correct HTTP server address is set in your
project's configuration file for proper dashboard access. Further customization options
are limited to widget selection and basic interface/network settings via the
dashboard.See also
API Extension
The System Dashboard can be extended using the Manager Service API as well as Node.js. These interfaces provide access to system-related data and allow developers to implement custom functionality, additional diagnostics, or project-specific extensions on top of the existing dashboard features.
By using the Manager Service API, it is possible to interact with backend services and retrieve detailed system information. The Node.js environment enables the development of custom services and logic that can be integrated into the dashboard.
This allows the dashboard to be flexibly adapted to project-specific requirements.
For more information, see Manager Service API and Node.js basics.
The following example shows how KPIs can be queried via the TypeScript interface of the System Dashboard. It demonstrates how a list of available KPIs can be loaded, how individual KPIs can be retrieved, and how multiple KPIs can be processed in a single call.
import { SystemDashboard } from "../VrpcClients/SystemDashboard";

async function main(): Promise<void> {
  try {
    const kpiList = await SystemDashboard.getKpiList();
    console.log("Available KPIs:", kpiList);

    const kpiPromises = kpiList.map((kpiName) =>
      SystemDashboard.getKpi(kpiName)
    );
    const kpiResults = await Promise.all(kpiPromises);

    kpiResults.forEach((kpi, index) => {
      const kpiName = kpiList[index];
      console.log(
        `KPI: ${kpiName}, Value: ${JSON.stringify(kpi?.value)}, Status: ${kpi?.status}`
      );
    });

    const kpis = await SystemDashboard.getKpis(kpiList);
    console.log("All KPIs:", kpis);

    console.log("Security events KPI:", kpis.security_siem_events);

  } catch (error) {
    console.error("Error while fetching KPIs:", error);
  }
}

void main();
This example shows:
- retrieving available KPIs using
getKpiList() - querying individual KPIs via
getKpi() - efficiently loading multiple KPIs using
getKpis() - accessing specific KPI values from the result object
Benefits of the System Dashboard in WinCC OA
- Central and clear presentation of all key system information
- Rapid detection of critical states and performance bottlenecks
- Quick access to security-related data and license status
- Easy monitoring with clear status icons and color coding
- Minimal configuration effort and immediate usability