Example Gauge Dashboard
This example guides you through creating a Dashboard showing a Gauge widget.
This application requires a running WinCC OA project, with the Dashboard Server Manager already set up and a WinCC OA user with edit and publish rights:
- Open the Dashboard in a browser on the same computer that WinCC OA is already running on, at the URL
https://localhost/data/dashboard-wc/index.html. - Login with your WinCC OA user.
- You can now see the main overview of all Dashboards. Add a new Dashboard with the Add Dashboard button in the upper right corner.
- The editing surface for new Dashboards is now open.
- Add the title "Gauge Dashboard" and a description for the Dashboard in the required languages.
- Set the background color with the color selector.
- Select an Icon from the icon selector.
- Save the Dashboard with the Add Button.
Figure 1. Gauge Dashboard Settings 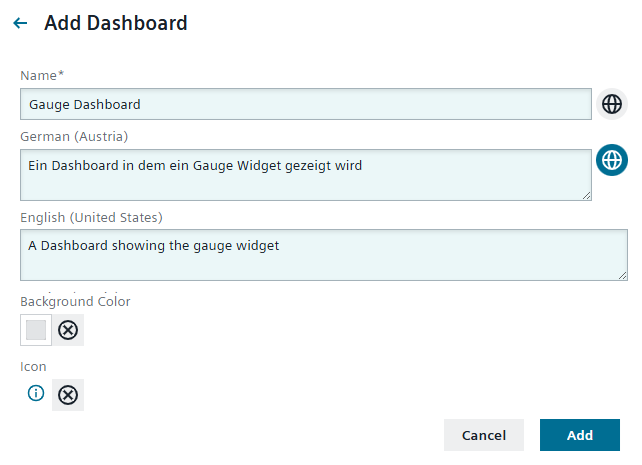
- The new Dashboard opens automatically.
- Click the Edit button in the upper right corner to open the edit surface for widgets.
- This automatically opens the list of Widgets. Select the Gauge widget by clicking on it.
- The settings for the Gauge widget will now open. Make the following adjustments:
- Expand the Widget Appearance section.
- Add the widget name "Gauge" to the title.
- Click the Icon area and select icon in the icon selector which pops up.
- Click the Background Color area and set a background color via the color selector that opens.
Figure 2. Gauge Settings 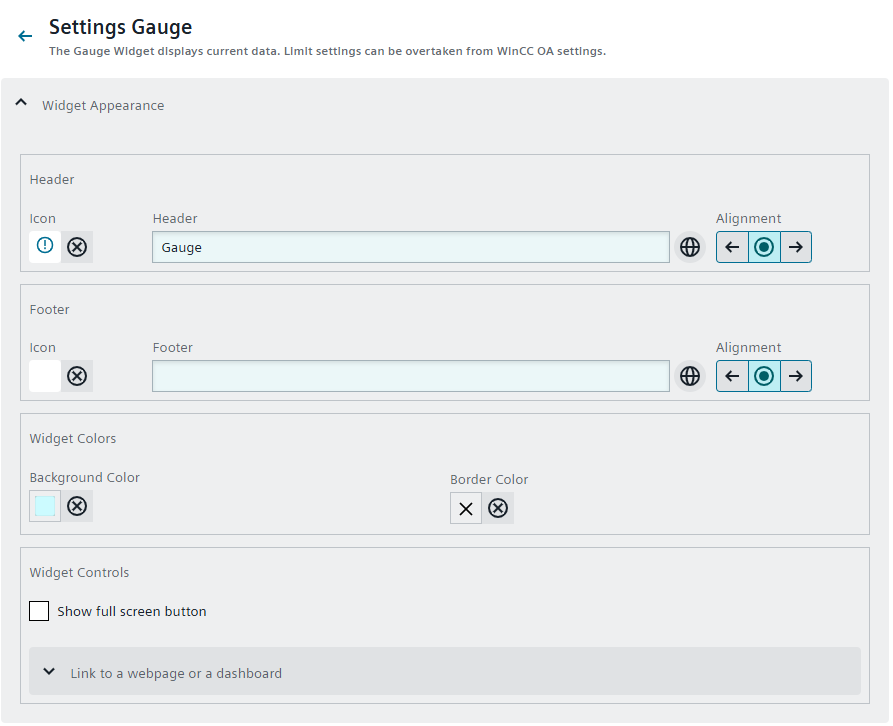
- Expand the Content section.
- Click on the Spyglass symbol to open the datapoint selection.
- Navigate to and select it by clicking.
- Click Select to confirm your selection.
Figure 3. Datapoint Selection 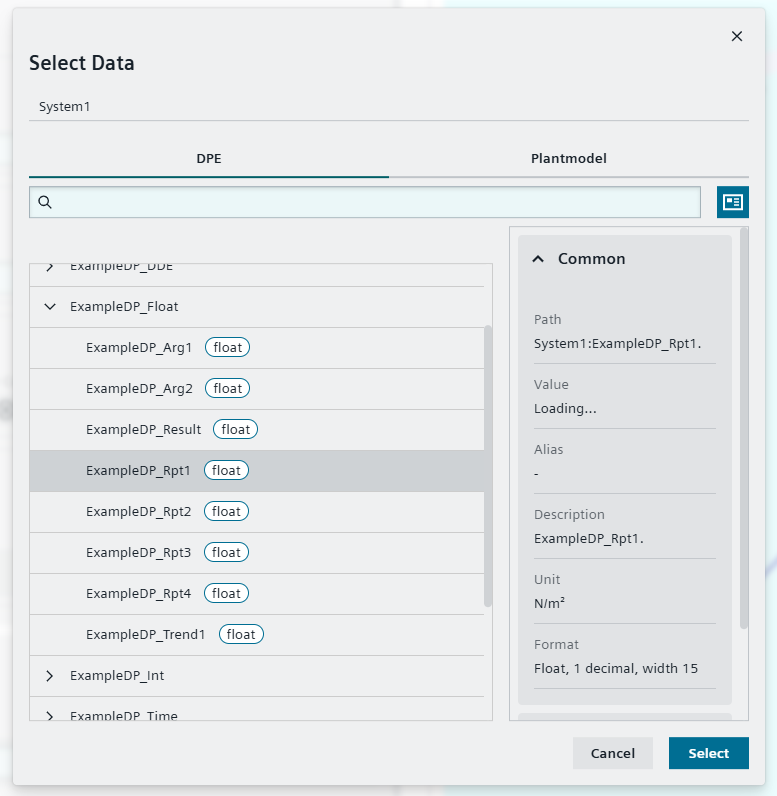
- Expand the Formatting Settings section.
- Check if the Chart Type is set to classic.
- Activate the checkbox for Tooltip to see a tooltip of the datapoint name and current value.
- Expand the Widget Appearance section.
- Save your changes.
- Expand the widget to an appropriate size by hovering over the sides until the cursor becomes a double-arrow and then clicking and dragging.
- Move the widget to the desired position on the dashboard by clicking in the darker title bar and dragging it.
- Save your changes with the Save button in the upper right corner.
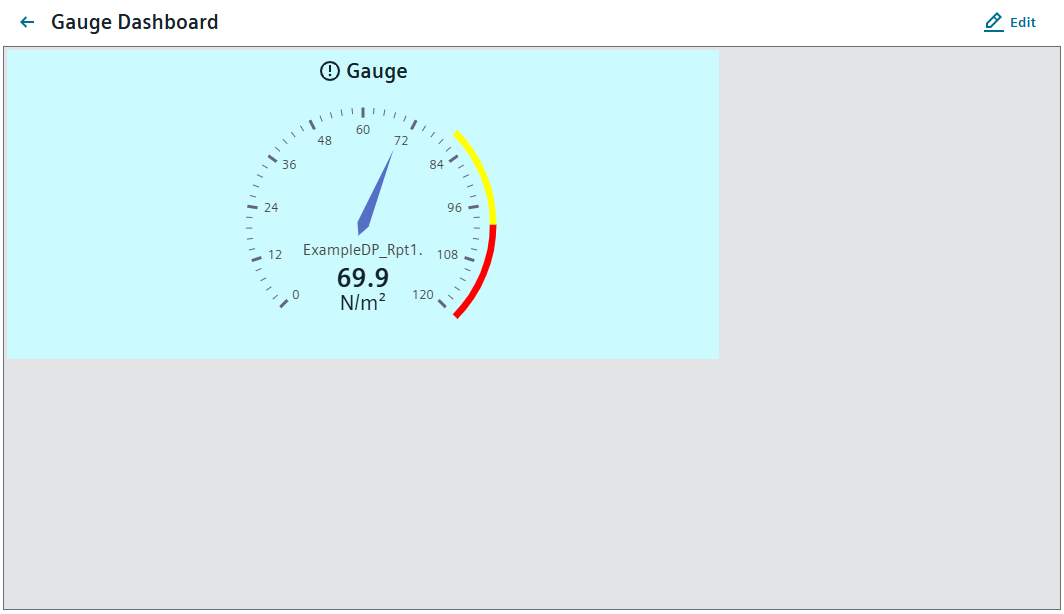
- The Dashboard is now open for viewing.
Figure 4. Gauge Dashboard