Introduction to the GIS Viewer
The WinCC OA GIS Viewer allows displaying and managing ESRI shapes files. Maps can be displayed and its possible to add objects to the maps. You can display maps and add shapes to your maps. You can also tie a shape layer to a WinCC OA _SumAlertPanel data point.
For basic information on the GIS Viewer see chapter GIS Viewer EWO.
This chapter describes how to integrate the GIS Viewer and what functions to use in order to display maps within the GIS Viewer.
The GIS Viewer provides a wide range of functions. You can find a list of all functions at the end of this chapter (see Functions for the GIS Viewer).
HOW TO ADD THE WinCC OA GIS VIEWER TO A PANEL
-
Add the WinCC OA GIS Viewer to a panel in the graphics editor GEDI. To do so, click on the EWO button
 and go to the
 wincc_oa_path/bin/Widgetsdirectory. Select the GisViewer.ewo and add it to your panel by clicking on the panel and stretching it to the desired size.
HOW TO ADD ZOOM STEPS
-
You have to apply some settings to the viewer. Therefore, use the CONTROL language. Add the code, for example, to the Initialize event of the GIS Viewer to define the number of the zoom steps.
In this example 10 zoom steps are set:
main()
{
  this.setSmoothSteps(10);
}
HOW TO LOAD WinCC OA COLORDB FILE
-
Loading of a WinCC OA colorDB file (color file) so that the viewer will recognize the WinCC OA colors by name. Any color file can be loaded. This can be used, for example, for assigning an alarm color to a graphical shape. Therefore, make sure that the file contains the names of the alarm colors. The following code shows how to load a colorDB file.
main()
{
  string strColorFile = getPath(COLORDB_REL_PATH, "colorDB");
  GisViewer_ewo1.loadColorFile(strColorFile);
}
HOW TO LOAD MAPS (ESRI SHAPE FILES)
The maps to be loaded are ESRI shape files. Add a code to en event script of the GIS Viewer. A map consists of three different files:
-
The actual shapes (*.shp).
-
An index file (*.shx). This holds the byte position of each shape. It is used by the viewer when loading the individual shapes from the *.shp> file.
-
A DBF file (*.dbf). This holds information about each shape. DBF is a database file in IV format. It contains information about each shape in the file. Typically it contains a ‘name’ for the shape, but it could contain any information field.
The GIS Viewer only uses the mandatory ".shp", ".shx" and ".dbf" files to draw a shape. ESRI shape files can contain additional data types, however, these files are not used by the GIS Viewer.
You can find free ESRI shape files in the internet. See http://www.mapcruzin.com/download_mapcruz.htm or http://www.gfk-geomarketing.de/en/digital_maps/digital_map_samples/shape.html.
Save the maps in one of the project subfolders, for example
data/Gis. Note hat you have to save all three different files
in the directory in order to load the map.
The following example shows how to load a map:
main()
{
  /*Specify the folder of the map (in this case "Gis") and the map name without extension
   (in this case: country, lakes, rivers, cities).
   "Gis/country" = Folder name / file name without extension */
  string strMap = "Gis/country";
  getPath(DATA_REL_PATH, strMap + ".shx");
  //download file
  getPath(DATA_REL_PATH, strMap + ".shp");
  //download file
  getPath(DATA_REL_PATH, strMap + ".dbf");
  //download file
  this.loadShapeFile(getPath(DATA_REL_PATH) + strMap, "COUNTRY");
  strMap = "Gis/lakes";
  getPath(DATA_REL_PATH, strMap + ".shx");
  //download file
  getPath(DATA_REL_PATH, strMap + ".shp");
  //download file
  getPath(DATA_REL_PATH, strMap + ".dbf");
  //download file
  this.loadShapeFile(getPath(DATA_REL_PATH) + strMap, "lakes");
  strMap = "Gis/rivers";
  getPath(DATA_REL_PATH, strMap + ".shx");
  //download file
  getPath(DATA_REL_PATH, strMap + ".shp");
  //download file
  getPath(DATA_REL_PATH, strMap + ".dbf");
  //download file
  this.loadShapeFile(getPath(DATA_REL_PATH) + strMap, "rivers");
   strMap = "Gis/cities";
  getPath(DATA_REL_PATH, strMap + ".shx");
  //download file
  getPath(DATA_REL_PATH, strMap + ".shp");
  //download file
  getPath(DATA_REL_PATH, strMap + ".dbf");
  //download file
  this.loadShapeFile(getPath(DATA_REL_PATH) + strMap, "cities");
}
The code above loads several shape files (COUNTRY, lakes, rivers, cities). In addition, it defines the names for the layers. In this case the names are "COUNTRY", "lakes", "rivers" and "cities". You can use the name later to refer to a layer. In this chapter the world map is used.
By default a layer is visible. You can hide a layer by using the function "hideLayer":
main()
{
  GisViewer_ewo1.hideLayer("lakes");
  GisViewer_ewo1.hideLayer("rivers");
  GisViewer_ewo1.hideLayer("cities");
}
To show a layer use the function "showLayer":
main()
{
  GisViewer_ewo1.showLayer("lakes");
}
HOW TO SET LAYER COLORS
-
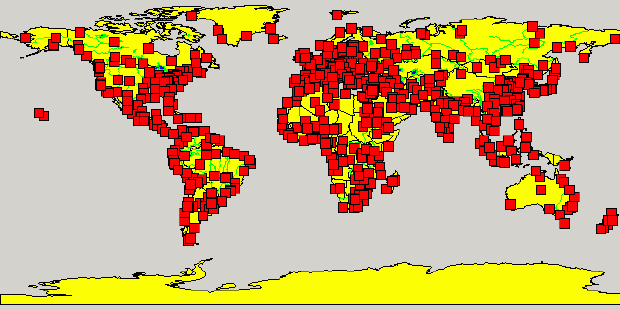
Each of the layers can be used for representation of different kind of areas, for example, countries, rivers or lakes. For this reason different layer colors are to set. The following example code shows how to set colors for layers:
main()
{
this.setLayerFillColor("COUNTRY", "yellow");
this.setLayerFillColor("lakes", "blue");
this.setLayerFillColor("rivers", "blue");
this.setLayerFillColor("cities", "red");
this.setLayerLineColor("cities","black");
this.setLayerLineColor("rivers", "Green");
this.setLayerLineColor("lakes", "Green");
this.setLayerLineColor("COUNTRY","black");
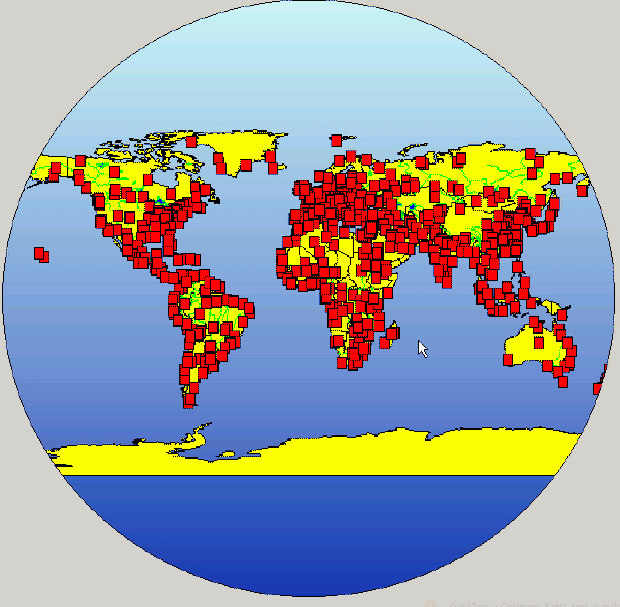
}Depending on the map(s) you use, the GIS Viewer could look, for example, as follows:
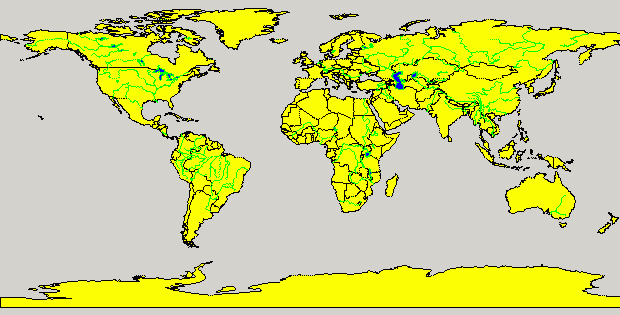
Above you can see the world map that is used in this example.
You can set the background color of the GIS Viewer to transparent in the property editor of the graphics editor and then set a graphic object with an image to the background of the viewer. When the viewer was loaded, the background image is shown.
HOW TO ADD SHAPES
-
You can use shapes in the GIS Viewer in two ways.
-
You can change the color of a shape that is available in one of the existing layers.
-
You can dynamically add new shapes to a new layer and change the color of these shapes. The example below shows how to add a rectangle dynamically to a layer.
When adding a shape to a layer this must prior been added using the function "addEmptyLayer".
-
To add a rectangle on top of Africa from upper right corner to lower left corner, use the function "addRectangleToLayer" as follows:
//- Longitude of Africa : -15, - Latitude of Africa: -36
//The upper right corner of Africa is at:  - Longitude : 43,  - Latitude : 35
main()
  GisViewer_ewo1.addEmptyLayer("SHAPES");
  GisViewer_ewo1.setLayerFillColor( "SHAPES", "green" );
  GisViewer_ewo1.addRectangleToLayer( "SHAPES", "MYRECT", -15, -36, 43, 35 );
  GisViewer_ewo1.addRectangleToLayer("COUNTRY","AUT", -15, -36, 43, 35);
}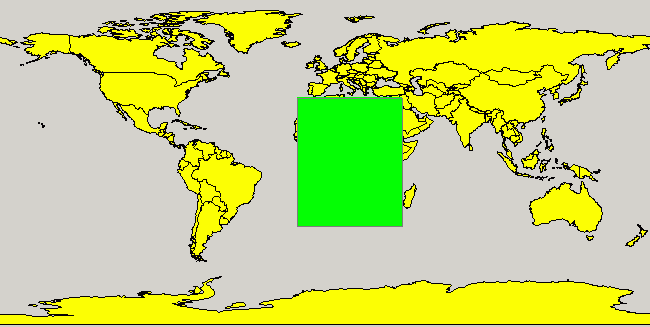
As shown in the code example above, you can add shapes to a map using the coordinates (longitude and latitude of a desired continent, country or city).
-
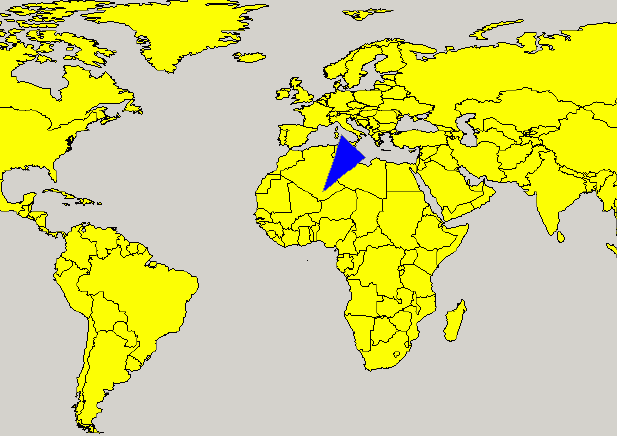
To add a polygon use the functions "addPolygonToLayer" and "addPointToPolygon" as shown below.
long addPolygonToLayer( string strLayer, string strName, long iNumPoints);
void addPointToPolygon( long pPolygon, int iIndex, double dX, double dY);
The function will add a polygon on the top of Algeria, Tunisia and Libya.
main()
{
  int i;
  GisViewer_ewo1.addEmptyLayer("POL");
  GisViewer_ewo1.setLayerFillColor("POL","blue");
  GisViewer_ewo1.home();
  i = GisViewer_ewo1.addPolygonToLayer("POL","POLI", 3);
  GisViewer_ewo1.addPointToPolygon("POL", i, 0, 5, 22);
  //add first point
  GisViewer_ewo1.addPointToPolygon("POL", i, 1, 18.5, 33);
  //add second point
  GisViewer_ewo1.addPointToPolygon("POL", i, 2, 10.8, 40.2);
  //add third point
}
HOW TO Zoom and Pan
-
There are several functions to zoom and pan the GIS Viewer. The functions are described in the following.
-
A GIS Viewer will typically contain several layers and each of the layers contains shapes (polygons, lines, rectangles). To zoom a set of shapes, assign a variable to the shape and use a zoom function to show all shapes with a specific value.
/* The function zooms an object automatically.
   In this case the object is "Luxembourg" in the field CAPITAL in the layer COUNTRY*/
main()
{
 GisViewer_ewo1.assignVariableToShape("COUNTRY", "CAPITAL", "Luxembourg", "Cit", 1) ;
 GisViewer_ewo1.zoomByVariableValue("Cit", 1);
}
The variables of the function "assignVariableToShape" are:
-
<Layer> Name of a layer.
-
<Field> Field used to identify a shape. Should be a unique field value.
-
<Field value> Value for the field that is used to identify one of the shapes.
-
<Variable> The name of a variable to be assigned to the shape.
-
<Value> The value for the variable. You can use the variable later, for example, to change the color of one or more shapes that contain this variable.
The code above will show all shapes that contain the variable "Cit" with the value 1.
-
To pan a map, use the "pan" function.
GisViewer_ewo1.pan(float fX, float fY);It will pan the map in X and/or Y direction. A value of 0.25 means that the map is moved with a quarter of the total visible area.
main()
{
  GisViewer_ewo1.pan(0.25, 0.0);
}-
To zoom in the map, use the "zoom" function.
GisViewer_ewo1.zoom(float fFactor);The function zooms in or out by the given factor.
The following code zooms out:
main()
{
  zoom(0.5);
}
The following code zooms in:
main()
{
  GisViewer_ewo1.zoom(2);
}-
To zoom a map to the full extent use the "home" function:
GisViewer_ewo1.home();main()
{
GisViewer_ewo1.home();
}HOW TO Get Map Information
-
You can use a range of functions to get information about the map and about the shapes:
-
To get the name of a specific layer, use the "getLayerName" function .
string getLayerName(int iIndex);main()
{
string lN;
int iIndex = 2;
lN = GisViewer_ewo1.getLayerName(iIndex);
DebugN("LayerName, Layer 1:", lN);
}-
To get the number of all layers use the "getNumLayers" function.
int getNumLayers();main()
{
int numLa;
numLa = GisViewer_ewo1.getNumLayers();
DebugN("Number of layers:", numLa);
}Note that the index of the first layer is 0.
-
To get the number of all objects in all layers, use the "getNumObjects" function.
int getNumObjects();main()
{
int i;
i = GisViewer_ewo1.getNumObjects();
DebugN(i);
}-
To get the number of all polygons in all layers, use the "getNumPolygons" function.
int getNumPolygons();main()
{
int i;
i = GisViewer_ewo1.getNumPolygons();
}-
To get the number of objects in a specific layer, use the "getNumObjectsLayer" function:
int getNumObjectsLayer(string strLayer);main()
{
int i;
i = GisViewer_ewo1.getNumObjectsLayer("SHAPES");
DebugN(i);
}The code above returns the number of objects of the layer "SHAPES".
-
To query the size of a map, you can use the event ExtentChanged. It returns the current size of the map.
ExtentChanged(double dZoom, double dLeft, double dTop, double dRight, double dBottom,
double dWidth, double dHeight,double dMiddleX, double dMiddleY)
{
  DebugN("Left:", dLeft,"Top:", dTop,"Right:", dRight,"Bottom:", dBottom,"Width:", dWidth,
  "Height:", dHeight);
}
HOW TO GET LAYER FIELD INFORMATION
-
A layer contains fields that describe the layer properties. To get information about the fields in a shape file several functions are available:
-
To get the number of fields in a layer use the function "getNumFieldsLayer".
int getNumFieldsLayer(string strLayer);main()
{
int i;
i = GisViewer_ewo1.getNumFieldsLayer("COUNTRY");
DebugN("Number of Fields in Layer:", i)
}-
To retrieve the name of a field in a layer use "getLayerFieldName".
string getLayerFieldName(string strLayer, int iIndex);The following code will return the first field of the layer "COUNTRY":
main()
{
  string Fn;
  Fn = GisViewer_ewo1.getLayerFieldName( "COUNTRY", 1);
  DebugN("Field 0 of Layer country", Fn);
}-
To retrieve the name of a specific shape in a layer use the function "getShapeNameInLayer".
string getShapeNameInLayer(string strLayer, int iFieldIndex, int iShapeIndex);The function will return the value of the field (iFieldIndex starts at 0) of the shape (iShape starts at 0).
main()
{
  string sN;
  sN=GisViewer_ewo1.getShapeNameInLayer("COUNTRY", 0, 0);
  DebugN(sN);
}
The code above will return the first shape in the layer "COUNTRY".
-
If you need the index of a specific field in a layer use "getLayerFieldIndex".
int getLayerFieldIndex(string strLayer, string strField);The function will return the index of the field 'strField' or -1 when the field was not found.
main()
{
  int i;
  i = GisViewer_ewo1.getLayerFieldIndex("COUNTRY", "NAME");
  DebugN("Field index of the field 'NAME' in layer COUNTRY:", i);
}
The code above will return the index of the field "NAME" in the layer "COUNTRY".
-
To retrieve all field indices, all objects and all shape names (countries) in a layer, you can use a FOR loop:
main()
{
  int i, j, k;
  k = GisViewer_ewo1.getLayerFieldIndex("COUNTRY", "NAME");
  DebugN(k);
  j = GisViewer_ewo1.getNumObjectsLayer("COUNTRY");
  for (i=0;i<j;i++)
  {
     string sN;
     sN = GisViewer_ewo1.getShapeNameInLayer("COUNTRY", k, i);
     DebugN("Shapes in layer COUNTRY", sN);
  }
}
HOW TO EXPORT LAYER INFORMATION
-
A CSV index file contains a list of all shapes and their fields. Export the layer information by using the function "exportLayerIndexFile".
void exportLayerIndexFile( string strPath, string strLayer);The function creates a file called "<layer>.csv" in the specified folder. The following code generates a CSV file "Country.csv under D:/.
The csv contains all the information about the world map (for example: region, continent, capital).
main()
{
  GisViewer_ewo1.exportLayerIndexFile("D:/", "COUNTRY");
}
HOW TO CHANGE COLORS
-
You can change the color of a shape by using various methods:
void
setShapeColorByName( string strLayer, string strField, string strShape, string strColor);
You can use the function to assign a color to the shape with the specified field and field-value in the specified layer. The following code sets the color of the rectangle (on top of Africa) "MYRECT" of the layer "SHAPES" to red.
main()
{
  GisViewer_ewo1.setShapeColorByName("SHAPES", "NAME", "MYRECT", "red");
}
-
voidsetShapeFillColor(string strLayer, string strField, string strShape, string lColor);
The code sets the layer fill color in the specified layer.
The following code sets the color of the shape "MYRECT" to green.
main()
{
  GisViewer_ewo1.setLayerFillColor("SHAPES", "NAME", "MYRECT", "{0,255,0}");
}-
In the same way you can set the line color by using the function
void
setShapeLineColor(string strLayer, string strField, string strShape, string lColor);
The code below sets the shape line color of the shape "MYRECT" to purple.
main()
{
  GisViewer_ewo1.setShapeLineColor("SHAPES","NAME", "MYRECT", "{255,0,255}");
}The line width of the layer the rectangle was added to was additionally set using the function "setLayerLineStyle".
-
You can reset both the fill and the line color. Use the two functions:
void resetShapeFillColor(string strLayer, string strField, string strShape);
void resetShapeLineColor(string strLayer, string strField, string strShape);
main()
{
GisViewer_ewo1.resetShapeFillColor("SHAPES", "NAME", "MYRECT");
GisViewer_ewo1.resetShapeLineColor("SHAPES", "NAME", "MYRECT");
}HOW TO LINK A _SumAlertPanel DP TO A SHAPE
-
The GIS Viewer can 'receive' the alarm status of the _SumAlertPanel data points and use this info to change the color of the associated shapes.
-
Call "PVSSSetSumAlertPanels" method to pass a list of _SumAlertPanel data points to the GIS Viewer. This should be a list of _SumAlertPanels
that you want to associate to shapes in the GIS Viewer.
-
Execute a dpQuery() or, for example, a dpQueryConnectSingle() to receive the alert color of the _SumAlertPanel data points and to pass the results
of the query to theGIS Viewer by calling "PVSSReceiveSumAlertStatus".
Note that the alert color of the alert must be defined in the color database (colorDB) that is used in the Gis Viewer! This means that when an object triggers an alert with an alert color and if this color is not defined in the color database (colorDB) that was loaded in the GIS viewer, the object does not blink!
-
Then use the function "PVSSLinkSumAlertToShape" to link the data point with a shape.
-
The following code sends the names of all SumAlertPanel data points to the GIS Viewer, queries the alarm colors of the SumAlertPanel DP's and passes them to the GIS Viewer using "PVSSReceiveSumAlertStatus". The code also links the shape "Austria" of the layer "COUNTRY" to a WinCC OA _SumAlertPanel data point. In case of an alert, the shape "Austria" will blink.
main()
{
  dyn_string strDefinition;
  dyn_string color;
  /*We can tell the GIS Viewer what _SumAlertPanel data points it needs to 'process'
  This example will just send the names of all data points to the viewer */
  dyn_string strTest = dpNames("*", "_SumAlertPanel");
  GisViewer_ewo1.PVSSSetSumAlertPanels((string)strTest);
  /*We can now make a 'mapping' that associates
  a shape with a certain _SumAlertPanel data point
  The definition string follows the syntax:
  "<Layer>@<Field>@<Value of field>@<Name of _SumAlertPanel data point>" */
  strDefinition = makeDynString("COUNTRY@NAME@Austria@System1:Panel1_1");
  GisViewer_ewo1.PVSSLinkSumAlertToShape(strDefinition);
  /*We now establish a query that will send the alert colors
  of the _SumAlertPanel data points to the GisViewer */
  string strQuery = "SELECT '.Warning:_alert_hdl.._act_state_color',
    '.Alert:_alert_hdl.._act_state_color',
    '.Danger:_alert_hdl.._act_state_color'
    FROM '*' WHERE(_DPT = \"_SumAlertPanel\")";
  dpQueryConnectSingle("CallBackSumAlertPanel", "MyId", strQuery);
}
void CallBackSumAlertPanel(string strID, dyn_dyn_anytype a)
{
  string strLine;
  string strOneLine;
  /*We turn the dyn_dyn_anytype that we receive into something more useful so that our GIS Viewer can handle it */
  for(int t = 2; t <= dynlen(a); t++)
  {
    if(t > 2)
    strLine += "|";
    /*Our GIS Viewer receives a list where each line looks as follows:
    <dp>,<warning color>,<alert color>,<danger color> */
    strOneLine = a[t][1] + "," + a[t][2] + "," + a[t][3] + "," + a[t][4];
    strLine += strOneLine;
  }
  /* Send the (formatted) dp's and colors to our GIS Viewer */
  GisViewer_ewo1.PVSSReceiveSumAlertStatus(strLine);
  DebugN("status of the sum alert panel data points:",strLine);
}
When using the GIS Viewer with the web client, you have to query the file path in the loadShapeFile() function using the function getPath()first. Query the file path in order to cache the maps for the GIS Viewer .
Functions for the GIS Viewer
| Available functions | Description |
|---|---|
| "addEmptyLayer" | Adds an empty layer to a map. |
| "addPointToLayer" | Adds a coordinate to a layer. |
| "addPointToPolygon" | Adds a point to a polygon. |
| "addPointToPolyline" | Adds a point to a polyline. |
| "addPolygonToLayer" | Adds a polygon to a layer. |
| "addPolylineToLayer" | Adds a polyline to a layer. |
| "addRectangleToLayer" | Adds a rectangle to a layer. |
| "addVarValueColorMapping" | Sets a color mapping table. |
| "assignVariableToShape" | Assigns a variable to a shape so that the shape can be approached by the variable. |
| "deleteAll" | Deletes all loaded layers and shapes of the GIS Viewer . |
| "drawTooltip" | Shows a tooltip. |
| "exportLayerIndexFile" | Exports a layer index file containing all layer information. |
| "getLayerFieldIndex" | Returns the field index for the specified field name in the specified layer. |
| "getLayerFieldName" | Returns the field name for the specified field index in the specified layer. |
| "getLayerName" | Returns the layer name for the specified layer index. |
| "getNumFieldsLayer" | Returns the number of fields for the specified layer. |
| "getNumLayers" | Returns the total number of layers. |
| "getNumObjects" | Returns the total number of objects. |
| "getNumObjectsLayer" | Returns the total number of objects for a layer. |
| "getNumPoints" | Returns the total number of points in all layers. |
| "getNumPolygons" | Returns the total number of polygons in all layers. |
| "getShapeNameInLayer" | Returns a shape name in a layer. |
| "getShapeXCoordinate" | Returns the x-coordinate for a shape. |
| "getShapeYCoordinate" | Returns the y-coordinate for a shape. |
| "getXLeft" | Returns the x-coordinate of the left edge of the area you are currently viewing. |
| "getXRight" | Returns the x-coordinate of the right edge of the area you are currently viewing. |
| "getYBottom" | Returns the y-coordinate of the bottom edge of the area you are currently viewing. |
| "getYTop" | Returns the y-coordinate of the top edge of the area you are currently viewing. |
| "hideLayer" | Hides a layer. |
| "home" | Zooms a map to the full extent. |
| "loadShapeFile" | Loads an ESRI shape file (a map for the GIS Viewer ). |
| "loadColorFile" | Loads a color file. |
| "maxWidthForText" | Sets the maximum text width for a map. |
| "memoryReport" | Creates a memory report. |
| "moveRectangle" | Moves a rectangle. |
| "pan" | Pans a map. |
| "PVSSLinkSumAlertToShape" | Links a sum alert data point to a shape. |
| "PVSSReceiveSumAlertStatus" | Passes the results of a dpQuery to the GIS Viewer . |
| "PVSSSetSumAlertPanels" | Passes a list of sum alert panels to the GIS Viewer . |
| "removePolyLineGradient" | Removes the polyline gradient |
| "resetShapeFillColor" | Resets the shape fill color. |
| "resetShapeLineColor" | Resets the shape line color. |
| "selectShapeVarAsShapeName" | Selects the field of a shape that is to be shown a text in the map. |
| "setAutoZoomExtra" | Set the offset of the autozoom functions. |
| "'setLayerClickEnabled" | Enables or disables the click events for the GIS Viewer. |
| "setLayerDrawAfterText" | Sets the selected layer at the top. |
| "setLayerFillColor" | Sets the fill color of a layer. |
| "setLayerLineColor" | Sets the line color of a layer. |
| "setLayerLineStyle" | Sets the layer line style. |
| "setLayerLineWidth" | Sets the layer line width. |
| "setLayerPointSymbol" | Sets a layer point symbol. |
| "setLayerVisibleRange" | Sets the visible range of a layer. |
| "setMinWidthLayer" | Sets the minimum width of a layer. |
| "setPolylineGradient" | Sets a polyline gradient. |
| "setPropShapeWildcard" | Sets a property of various shapes that match a wildcard. |
| "setShapeColorByName" | Sets a shape color by shape name. |
| "setShapeFillColor" | Sets the fill color of a shape. |
| "setShapeIcon" | Sets an icon for a shape. |
| "setShapeLineColor" | Sets the shape line color. |
| "setShapePVSSSymbol" | Sets a panel reference for the GIS Viewer . |
| "setSmoothSteps" | Sets smooth steps for a map. The map will be zoomed smoothly in the given steps. |
| "setTextVisible" | Sets a text in a layer visible. |
| "showLayer" | Shows a layer. |
| "showShapesAll" | Shows all shapes for a layer. |
| "showShapesWildcard" | Shows shapes by wildcard. |
| "updateShapeAndAutoZoom" | Updates a shape with a color and zooms it in. |
| "zoom" | Zooms a map in or out. |
| "zoomByVariableValue" | Zooms a map by using a variable value. |
| "zoomByWildcard" | Zooms a map using a wildcard. |