
Trend Configuration Panels
The configuration of most aspects of a trend is handled in the specific tabs and areas of the Trend Attribute Editor
Trend Attribute Editor
The Trend Attribute Editor is the interface for most specific trend configurations. It is opened automatically after the initial placement of a trend widget or at any time by double clicking the Trend.
It contains the following tabs:
Common Tab
Within this area the general settings for your trend are adjusted.
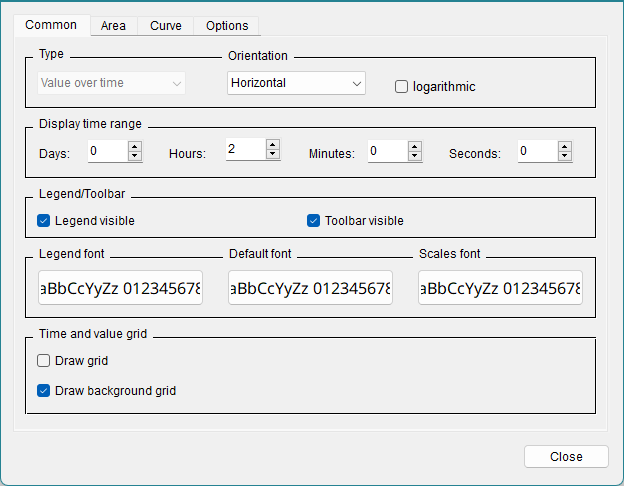
Type and Orientation
Defines the type of trend (value-over-time or value-over-value) and whether the curve is drawn form left to the right (Horizontal) or from the top to the bottom (Vertical). The checkbox defines if this Trend is logarithmic.
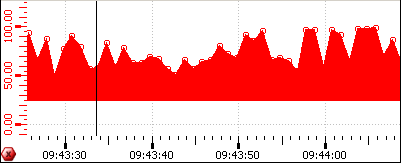
Display time range
Select here the time range, which will be displayed by default on the Y axis after opening the trend. A maximum of 999 days can be displayed. Using the zoom (scroll wheel), the time range can be adjusted to own needs afterwards.
If you do not want to display a value ( e.g. hours, days, minutes or seconds) to be displayed you have to enter a zero (not a blank) into the specific field.
When the selected time range is 1 second (in case of the trend type "value over time"), milliseconds are shown as well.
Legend/Toolbar visible
Sets the legend defined in the Curve tab to visible or invisible.
Enables or disables the toolsbar of the trend (zoom in X and Y direction, stop and start trend, 1:1 display, etc.).
Legend font, Default font, Scales font
Click on one of the buttons to define the font for the legend, common texts or the X and Y axes.
Time and value grid
Tick the Draw grid checkbox to display vertical grid lines in the trend (for horizontal grid lines see Grid tab of a curve). The grid lines are in the foreground of the curve, i.e. if a filling of the curve was selected (see Curve Common tab), the grid lines are shown in the foreground of the filling.
Tick the Draw background grid checkbox to display the grid lines in the background of the curve.
The grid lines are connected to the X and Y axes. This means that the grid is not placed firmly on the trend window, but automatically adjusts to the zoom of the X-and Y-axis.
Area Tab
In this section you can append additional trend areas and define the time scale and its format. This area is opened with the corresponding Area tab.
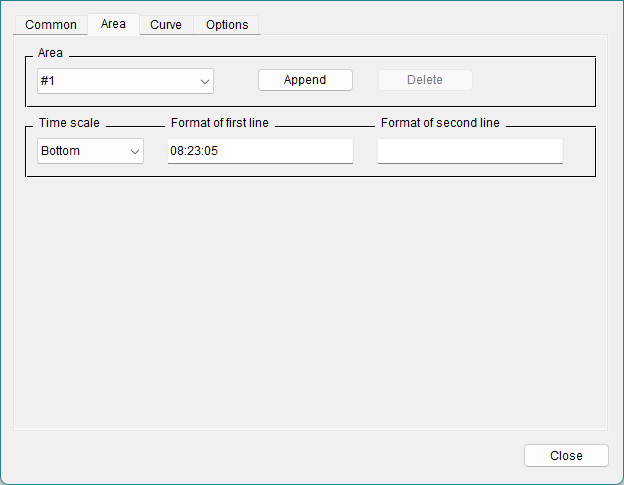
Area
You can select the areas (if more than one has been created) from the combo box.
Append
Opens a DP selector for the new area. Enter the name directly or select a datapoint using the DP selector button.
Delete
Use this button to delete the displayed area
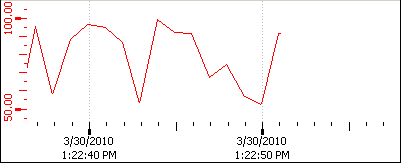
Time scale
You can choose one of the three different options (None, Bottom or Top) from the Time scale combo box. Bottom displays the time at the bottom of the diagram, the top option again allows you to display the time in the top of the diagram. If you do not want to display the time, choose the none option.
Format of first line/second line
The label of the time scale can be shown either in one line or on two lines. In these fields you can define the format of the labeling on each line separately.
Click in the text box to open the Time format selector.
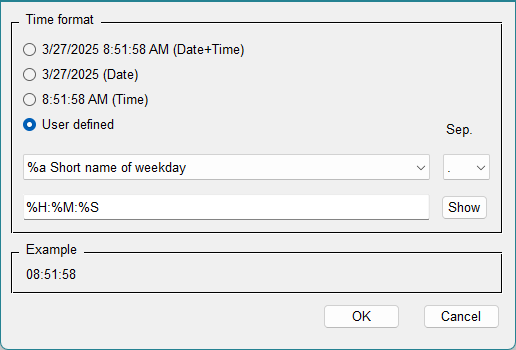
The time format selector allows you to choose different time formats: Date+Time, Date, Time or you can define the format yourself (user-defined).
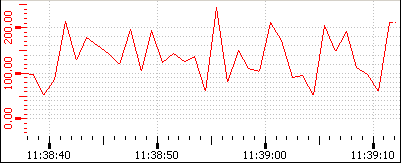
If e.g. the Date format was selected for the first line and Time for the second line, the time scale is displayed in the trend window as follows:
Curve Tab
This tab shows the selected curve and area, as well as different information grouped into the sub-tabs common, legend, grid and scale.
Common Tab
The Common tab is where the properties of the curve are defined (color, style, name, connected datapoint element, etc.).
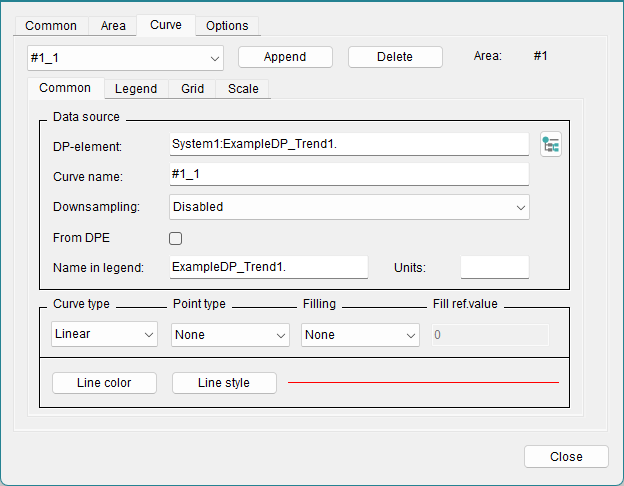
Data Source
The curve name is entered in the Common tab of the trend curve. It must be unique and should characterize the curve. Press the enter key to apply the curve name. The new curve name is updated in the combo box above the curve tabs after closing and reopening the trend editor.
The check box From DPE takes labels from the datapoint element.
The combobox Downsampling allows you to display aggregated values for the selected time range. This helps to reduced the necessary bandwidth to load data within the trend. Alternatively, the function can also be activated by using the Control function "curveResample".
Please be aware that the combobox is only available for projects which are using NGA databases and downsampling cannot be used for value-over-value trends.
The legend label for the curve is entered below. This is the name of the curve as it will appear in the legend of the trend.
Display options
Curve type
This is where you select your curve type from a choice of Points (individual points, curveType 0), Linear (points linearly connected, curveType 2), Steps (points connected in step fashion, curveType 1) and Event (Event Curve, curveType 4).
Point type
Optionally, you can select the point format for the curve type or for the minimum and maximum marking (see below). You can select one of the following types:
- Rectangle
- x
- +
- *
- O
- Triangle
- O filled
- Triangle filled
A user-defined marker can be added using the function "curvePointIcon".
Filling
The area beneath the curve can be filled with the line color.
The fill can be related to a reference value; in this case the area between the value of the curve and the reference value is filled. This reference value can also be above the line to fill the upper part of the curve.
The area above the curve can be filled with the line color.
You can also set this by using the functions "curveFillType" and "curveFilled".
Fill ref. value
Enter here the reference value to which the curve fill relates.
Line color
Opens the color selector, where you can select the color for the curve in the trend. Dynamic colors can not be displayed inside the trend widget and so must not be used.
Line style
Opens the line style selector. This can also be set with the function "curveLineType". You can select one of the following line styles:
___________________ [solid]_ _ _ _ _ _ _ _ _ _ _ _ [dashed]. . . . . . . . . . . . . . . . . [dotted]- . - . - . - . - . - . - . - . - [dash_dot]- .. - .. - .. - .. - .. - .. - .. [dash_dot_dot]
Specify the width of the line as well as how the line "Join" and line "Cap" should look like.
- Join
-
- Miter [JoinMitter]
- Round [JoinRound]
- Bevel [JoinBevel]
- Cap
-
- Flat [CapButt]
- Round [CapRound]
- Square [CapProjecting]
Buttons
- Append
- Appends additional curves to the area. Thus, the values of another data point element can be displayed in the trend. Up to 16 curves are possible within an area.
- Delete
- Deletes the curve chosen from the combo box.
Legend tab
The Legend tab defines the representation of the value in the legend.
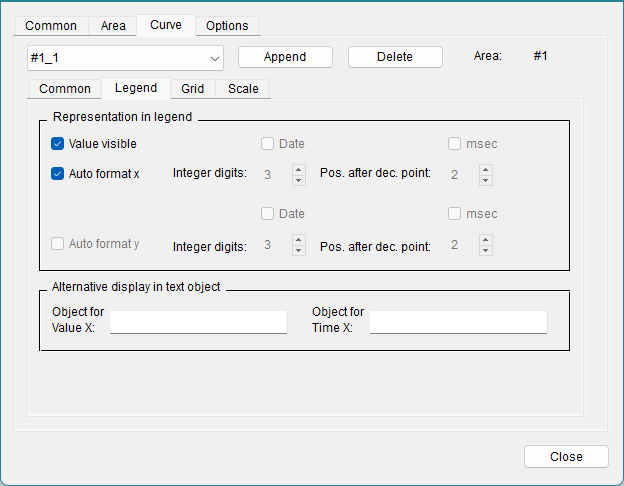
Representation in Legend
- The Value visible option displays the current value of the datapoint element in the trend legend.
- The Auto format x checkbox automatically formats the legend for x. Disable it to define further details for the x axis (see above).
- The integer digits and the positions after decimal point options define the value can be displayed with in the legend.
- The Date and msec (milliseconds) can be selected here to be shown in the legend.
- Auto format y formats the legend for the y axis if the curve type value-over-value was chosen.
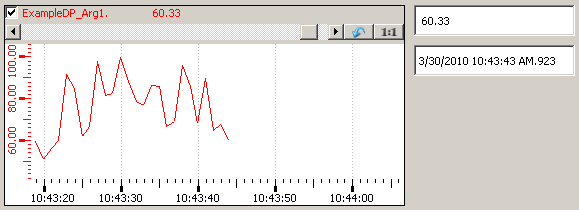
Alternative display in text object
Provides the output of the current value and the current time/value of the curve value, e.g. in text fields outside of the trend. This option can be used instead of the legend. As the legend,Alternative display in objectalways displays the latest value.
Object for Value X
Enter here the name of the text object in which the current value should be displayed.
Object for Value Y
Enter here the name of the text object in which the current time/value should be displayed.
Grid Tab
The Grid tab defines the spacings and number of grid lines, which should be displayed above or below a specific reference point.
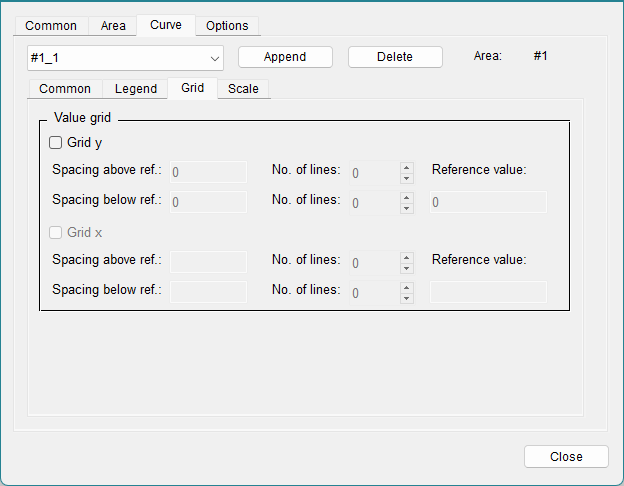
Reference value
With the aid of the reference value, a line on the y axis between the above and below grid lines is defined. This means that if e.g. the reference point is 100 and 5 grid lines with a spacing of 20 were defined above the reference value, then horizontal grid lines are displayed at the values 120, 140, 160, 180 and 200 of the Y axis of the trend. For the trend type value-over-time, horizontal and logarithmic, the reference value has to be bigger than 0.
Spacing above ref.
Defines the spacing between the grid lines above the reference value.
Spacing below ref.
Defines the spacing between the grid lines below the reference value.
No. of lines
Defines the number of grid lines, which are displayed above/below the reference value in the spacings defined above.
The grid lines are connected to the X and Y axes. This means that the grid is not placed firmly on the trend window, but automatically adjusts to the zoom of the X-and Y-axis.
The Grid x is provided for the grid in the x-direction.
Scale Tab
The Scale tab is used to define the representation of the scales within a trend.
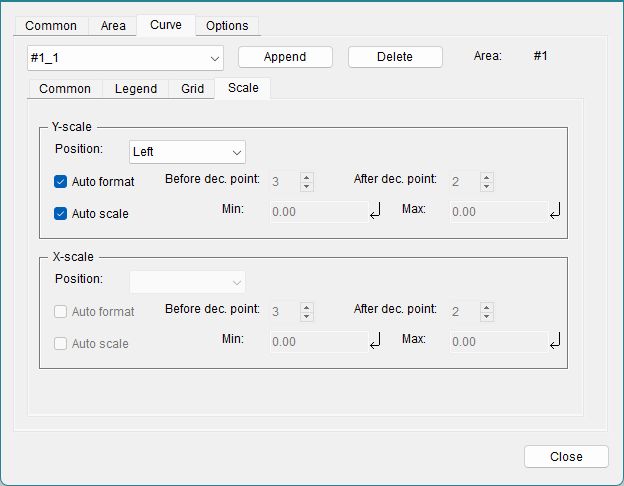
The options for both Y and X axes are largely the same.
The position of the scale can be set to the Left or Right side for the Y axis, and Top or Bottom for the X axis. The scales can also be displayed not at all.
With Auto format, the values will be formatted automatically.
If the Auto format is not enabled for the Y-scale in a logarithmic value-over-time trend with horizontal orientation, it is only possible to edit the position after decimal points and the format has to be set to exponential.
Auto scale and Min. Max.: here you can define either an automatic scaling or the maximum and minimum values of the axis. Keep in mind that the minimum and maximum values per curve have to bigger than 0 for a logarithmic trend. The Min and Max Values can be used as Borders for the Event curve. In this case the auto scaling must be deactivated.
Options Tab
With the Options tab you can define settings for time leaps and zoom.
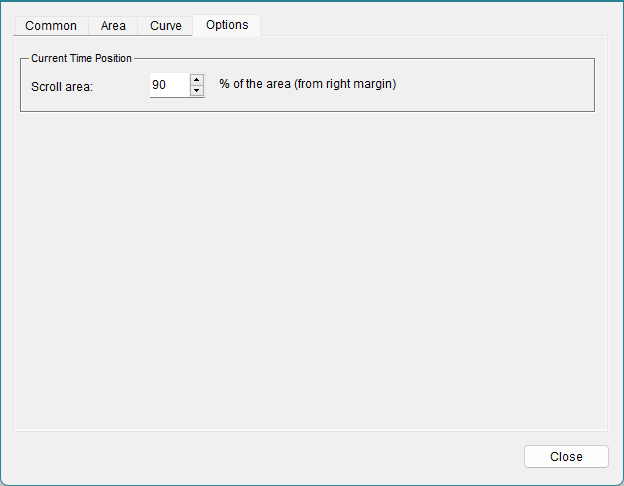
Current Time Position
In the "Current Time Position" section you can specify the percentage of the curve that remains displayed when the curve start point is reset. This editor field is only available for the value-over-time format. The curve is always reset when its last point reaches the right-hand edge of the element. A leap of 99 percent, for example, results in the curve being constantly displayed. The size of the leap is selected by clicking on one of the spin button arrow heads.
A double-click on the trend in the panel during engineering opens the Trend configuration panel.
To further customize your Trend, consider the trend graphics functions.