
Functionalities of the Trend
The Trend widget provides the features listed on this page.
Ruler
A fixed ruler you can open and close using the left mouse button. If the ruler is positioned, the automatic refresh to now-time is deactivated. The view will be frozen at the time the ruler has been set. The trend run will not be stopped, only the view will be frozen - thus zooming and other functions are allowed. If the ruler is deactivated, the current view persists. If the update of the trend view is stopped, a red icon is shown in the bottom left corner of the trend (see figure below).
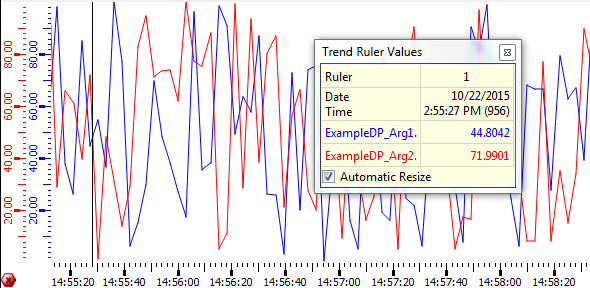
In addition, a tool window with the trend ruler values pops up. The tool window informs you about the date and time of the ruler position, as well as the current curve values. The tool window can be moved and closed.
The tool window can be customized by adjusting the corresponding panel located under "/panels/trendRulerPanel.pnl". For more information see Trend Ruler Window Customization.
Press the left mouse button + Shift key to set a differential ruler in addition to the already set ruler (see figure above). Now the tool window shows the following data:
- Start date and time of the historical first ruler
- End date and time of the historical second ruler
- Difference between start and end
- Curve values of the ruler position and the differential ruler position
- Value difference between the curve values of both rulers
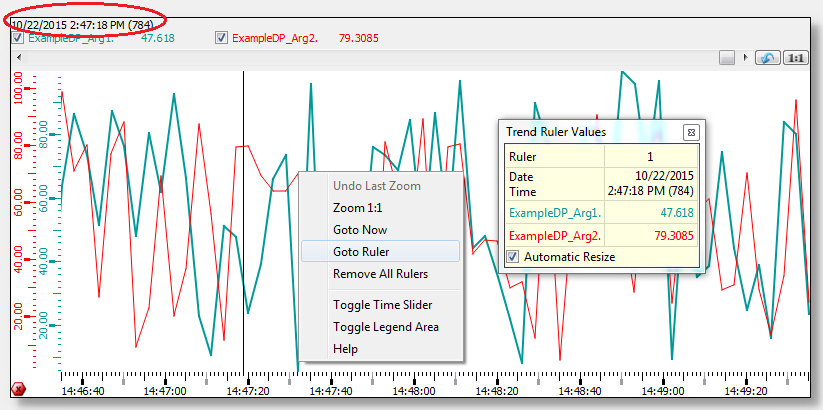
Use the ""legendShowsTimeLabel"" attribute to show the date and time of the ruler or the current date with now-time in the legend, when the ruler is not present in the current trend view.
Use the middle mouse-button + Ctrl key to move the ruler to another position. The ruler can be moved in the trend as long as the middle mouse-button is pressed.
The ruler can be deactivated by a mouse-click on any other position in the trend. Thereby the view will not jump to now-time, but remain on the view of the now deactivated ruler. Use the context menu option to switch to now-time.
You can navigate the ruler using the cursor keys. To do that, the ruler must be activated inside the trend (using a mouse click). Now the cursor keys can be used. Using SHIFT + Cursor Key allows you to use the differential ruler and Ctrl + Cursor Key increases the navigation speed of the ruler.
The ""maxRulerCount"" attribute allows you to use several rulers in a trend area. The rulers are distinguished by numbers. The values of the additional rulers will be added to the Trend Ruler Values window.
The differential ruler can be displayed with the left mouse button and the shift key. The difference is calculated between the first ruler and the differential ruler. It remains visible when the buttons are released and will be hidden again when a new differential ruler is triggered, the ruler is moved or otherwise changed, the time axis is changed (either shifted or zoomed) or the trend size is changed (by applying a zoom factor or changing the panel size).
The middle mouse button can not be used in case of several rulers.
The rulers can be removed altogether with the "remove all rulers" entry in the context menu, or individually by a left mouse click on the particular ruler. If you press the left mouse button, you can draw the ruler to another position. Note that by using the option Remove All Rulers, both vertical and horizontal reference lines are removed.
Value-Axis Rulers
you can also set rulers for the value axis by clicking directly on the value axis or Shift + Click on the trend curve add a new value axis ruler. If the mouse cursor is pointed on an intersection between a value axis ruler and a curve, the next curve value to this intersection point is displayed. Clicking directly on the ruler will remove the value axis ruler. The color of the ruler matches the curve color for which the ruler has been set. The line type value axis ruler is always displayed as a dotted line.
Scales
The trend has two scales - the vertical value scale of each curve and a shared horizontal time scale. The value scales are shown in the corresponding colors of the curves. Red tick marks show the beginning of a month on the time scale. Gray tick marks indicate that the whole text cannot be shown on the time scale (the text is too long/big).
Both scales can be moved by a mouse-click - hold left mouse-button pressed and move, then release. You can achieve the same effect by holding the scrolling wheel + Shift key pressed.
When scrolling the trend, the database request will be delayed by 0.5 seconds. If you continue scrolling during this timeout, the timer will be restarted. The request will complete when no scrolling process has been performed for 0.5 seconds.
To zoom/move the time scales of several trend areas (see Area tab) collectively, the function "visibleTimeRange" can be used.
To display the time scales of the trend areas shifted in time while being able to zoom/move the time scales of several trend areas, the following script can be used in the TrendScroll event:
int lastArea = -1;
main(time start, time span, int area)
{
  if ( area == lastArea )
  {
    lastArea = -1;
    return;
  }

/*Defines that as soon as the time scale of a trend area is zoomed/moved,
    the shown time difference between the two available trend areas is 7200 seconds (2h)*/

  int diff = area == 0 ? -7200 : +7200;

/*Determines the current trend area and thus the trend area whose time range will be moved by 2h*/
  int other = area == 0 ? 1 : 0;


/*The following is shown in the log viewer:
    start time, time span of the visible time range in seconds, trend area number,
     start time + difference of 2h and start time + difference of2h + time span.*/
  DebugN(start, (float)span, area, diff,(int)start + diff, (int)start + diff + (int)span );


/*The visible time range of the time scale of the current trend area is set
    - beginning with start time + difference of 2h and ending with start time + difference of 2h + time span.*/

  setValue("", "visibleTimeRange", other, (int)start + diff, (int)start + diff + (int)span);

  lastArea = other;
  time end;
  getValue("", "visibleTimeRange", other, start, end);
  DebugN(start, end);
}
Legend
The trend legend shows the names of the datapoint elements in the corresponding colors of the curves. Additionally, the current value/time (when the ruler is deactivated) or the ruler value/time of each curve is shown. Use the "Toggle Date-Time and Value Display" option from the legend context menu to hide the date and time display.
The shown curves can be hidden/shown in any combinations. Tick the specific checkbox of a curve in the legend or remove the tick from a combobox, respectively.
Zoom
You can zoom in a defined trend range using the mouse. Press the left mouse button, select the area you want to zoom and drag the appearing rectangle bigger or smaller in order to activate the zooming functionality. If the mouse pointer is only moved within the horizontal and vertical border, you can only zoom in one direction.
You can also zoom with the scrolling wheel, whereby all curves are zoomed in both directions within the trend plotting area (value+time or x+y in case of x/y trend). On the time scale, only time will be zoomed (the time format conforms to zoom level with the precision of milliseconds). On the value scale, only the specific curve in value direction will be zoomed.
Other Special Operations
- Using Ctrl (key down) and left mouse button, you can drag trend curves within the trend (panning).
- If the invalid bit is set for a datapoint, the trend curve is shown with a pink marker and dotted line. Filled curves are shown using cross-hatch. How an invalid range is shown can be specified by the config entries [ui] trendInvalidColor, [ui] trendInvalidLineType and [ui] trendInvalidFillType. See chapter User interface.
- Using the center button of the mouse and the CTRL key, you can select a specific time and the value including the time will be shown in the legend. The specific time and the value will also be shown in graphics objects, if these are used for the alternative display of values.
- If the DIST managers in a distributed system are disconnected, the trend
legend will show the "disconnect" icon
 next to the datapoint
name. Additionally, the curve changes to dotted purple and the time of the
disconnect is stamped by a purple dot.
next to the datapoint
name. Additionally, the curve changes to dotted purple and the time of the
disconnect is stamped by a purple dot. - When using the AutoScale function, no scaling will be performed while the Trend is stopped or when values only change outside of the visible range. If the ruler is moved from the view of past values to the current time, no automatic scaling will be performed.
If you open a trend for a value that is not archived and scroll the curve so that you cannot see the curve anymore, the values that were shown before are not shown anymore.