
Trend widget
The Trend widget is an advanced visualization tool designed to provide a comprehensive view of how two or more values change in relation to one another over time. This powerful feature is essential for tracking and monitoring performance metrics, analyzing emerging patterns, and identifying anomalies. By leveraging the Trend widget, users can make informed, data-driven decisions that enhance operational efficiency and strategic planning.
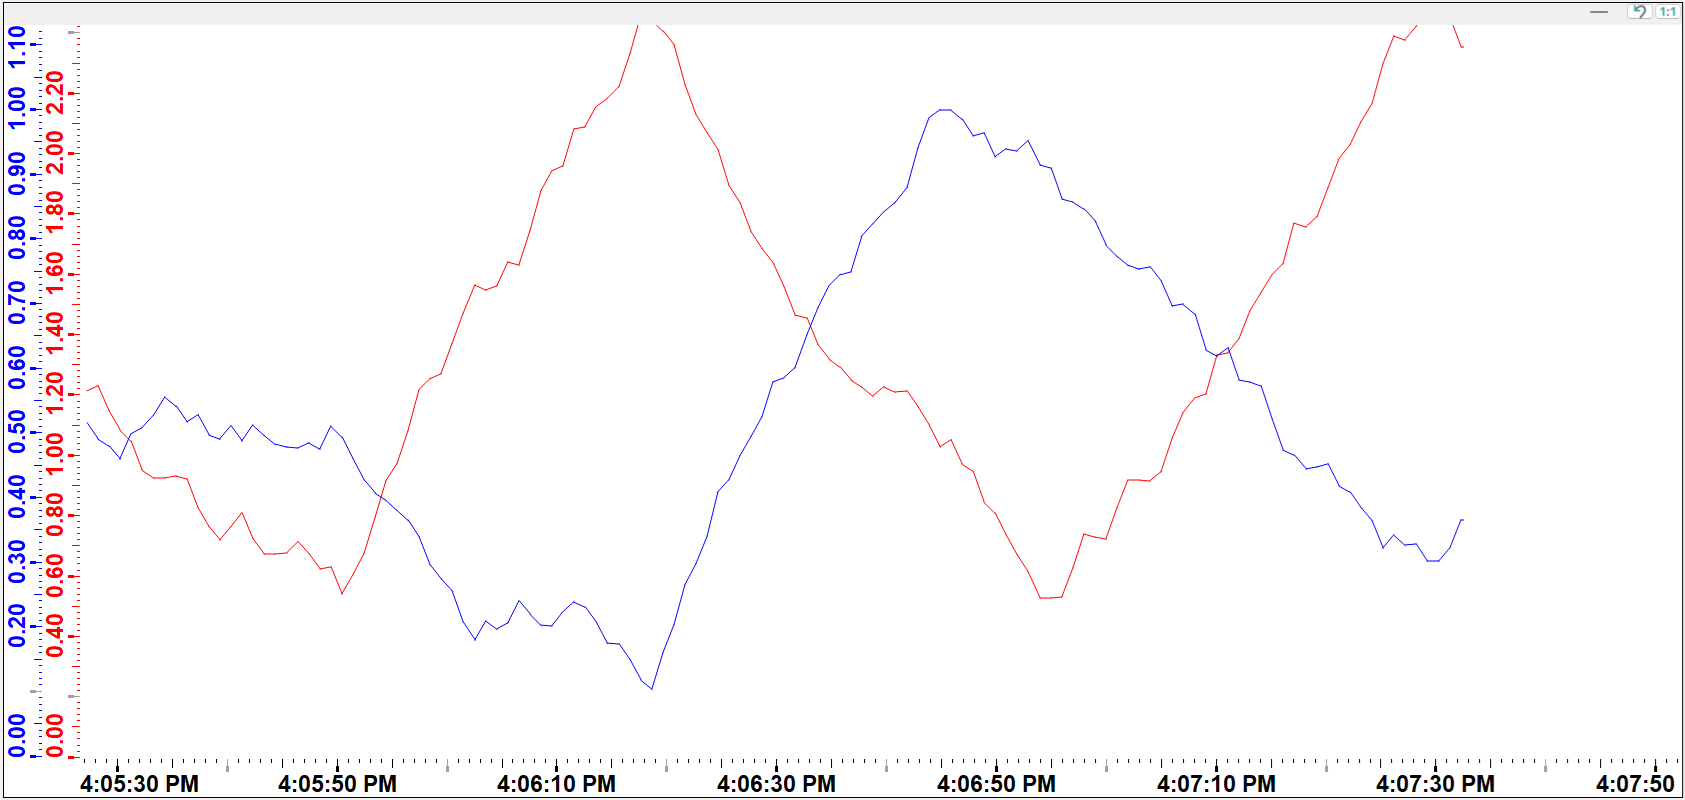
At its core, the Trend widget excels in displaying value-over-time curves, offering a dynamic representation of data trends. Users can create an unlimited number of hierarchical curve display areas, each equipped with customizable scales and legends. This flexibility allows for both value-over-time and value-over-value diagrams, catering to a wide range of analytical needs.
One of the standout features of the Trend widget is its ability to display logarithmic trends. Unlike linear trends, logarithmic trends present values on a logarithmic scale, making it easier to visualize data that spans several orders of magnitude. This is particularly useful for analyzing data with exponential growth patterns or significant variability.
Trends are invaluable for visualizing changes in datapoint values over specific periods or for correlating changes between different datapoints. For instance, users can track temperature variations over time or analyze the relationship between temperature and pressure. By providing a clear and detailed view of these relationships, the Trend widget empowers users to uncover insights that might otherwise remain hidden.
Creating a Trend
If you want to create a trend element, you can either select the element by clicking in the menu or click on the Trend icon (![]() ) in the icon bar. It is then possible to create either a
value-over-time trend, a value-over-value trend.
) in the icon bar. It is then possible to create either a
value-over-time trend, a value-over-value trend.
Value-over-time trends display the way a value changes over a certain period of time. Value-over-value trends display the relationship between two values as they change.
A logarithmic trend is a type of data pattern where the rate of change decreases as the value increases, typically represented by a logarithmic function. For logarithmic trends, the application of logaritmic scales is possible on both the x and y axes.
Follow these steps to create a trend:
- Click on the trend object in the GEDI.
- Click in the panel work area. Drag the frame to the required size.
- The Trend Editor opens automatically and a child panel appears to specify the
trend type and orientation for the time axis in a value-over-time trend.
Figure 2. Child panel for selecting the trend type 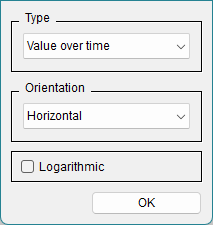
- Select the desired trend type and click on OK.
- In the subsequent pop-up dialogue, select a datapoint (e.g. ExampleDP_Trend1 ) or a $parameter as the data source. For the value-over-value trends, define two datapoints. You can also use a CNS name. In this case the CNS name is shown unless the DPE linked to a CNS node does not have a description. This also applies when the trend is opened with the function openTrendCurves(), in which case it is necessary to use the "ID Path" (refer to the chapter Editor/Node ID for further information).