Area Tab
In this section you can append additional trend areas and define the time scale and its format. This area is opened with the corresponding Area tab.
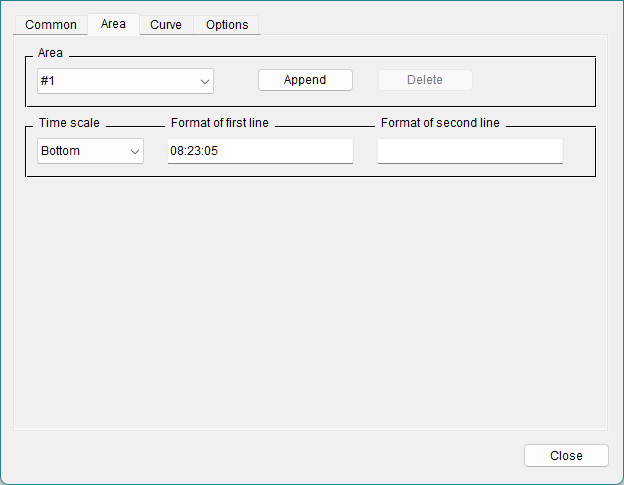
Area
You can select the areas (if more than one has been created) from the combo box.
Append
Opens a DP selector for the new area. Enter the name directly or select a datapoint using the DP selector button.
Delete
Use this button to delete the displayed area
Time scale
You can choose one of the three different options (None, Bottom or Top) from the Time scale combo box. Bottom displays the time at the bottom of the diagram, the top option again allows you to display the time in the top of the diagram. If you do not want to display the time, choose the none option.
Format of first line/second line
The label of the time scale can be shown either in one line or on two lines. In these fields you can define the format of the labeling on each line separately.
Click in the text box to open the Time format selector.
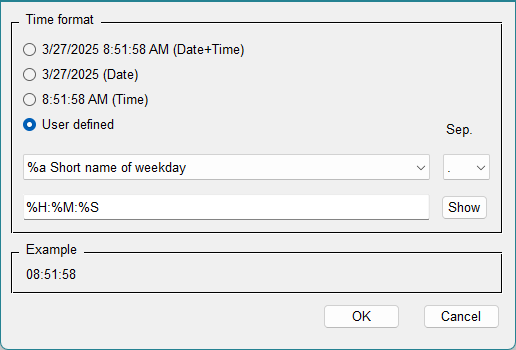
The time format selector allows you to choose different time formats: Date+Time, Date, Time or you can define the format yourself (user-defined).
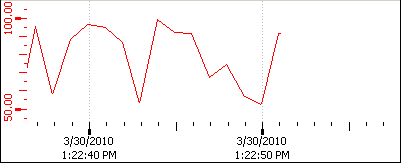
If e.g. the Date format was selected for the first line and Time for the second line, the time scale is displayed in the trend window as follows: