CTRL Debugger Panel
A manager can execute several CTRL scripts simultaneously. A script can contain several threads. You can analyze a script or a thread in the script.
Open the CTRL debugger panel via .
Or via the same symbol  in the WinCC OA console. Control (CTRL) and UI managers can be debugged.
With the CTRL Debugger you can debug scripts or threads. The scripts can, however, not be changed in the debugger. You can, however, open a script in the script editor via the CTRL debugger or a panel in the GEDI. See further below.
ScopeLibs cannot be debugged!
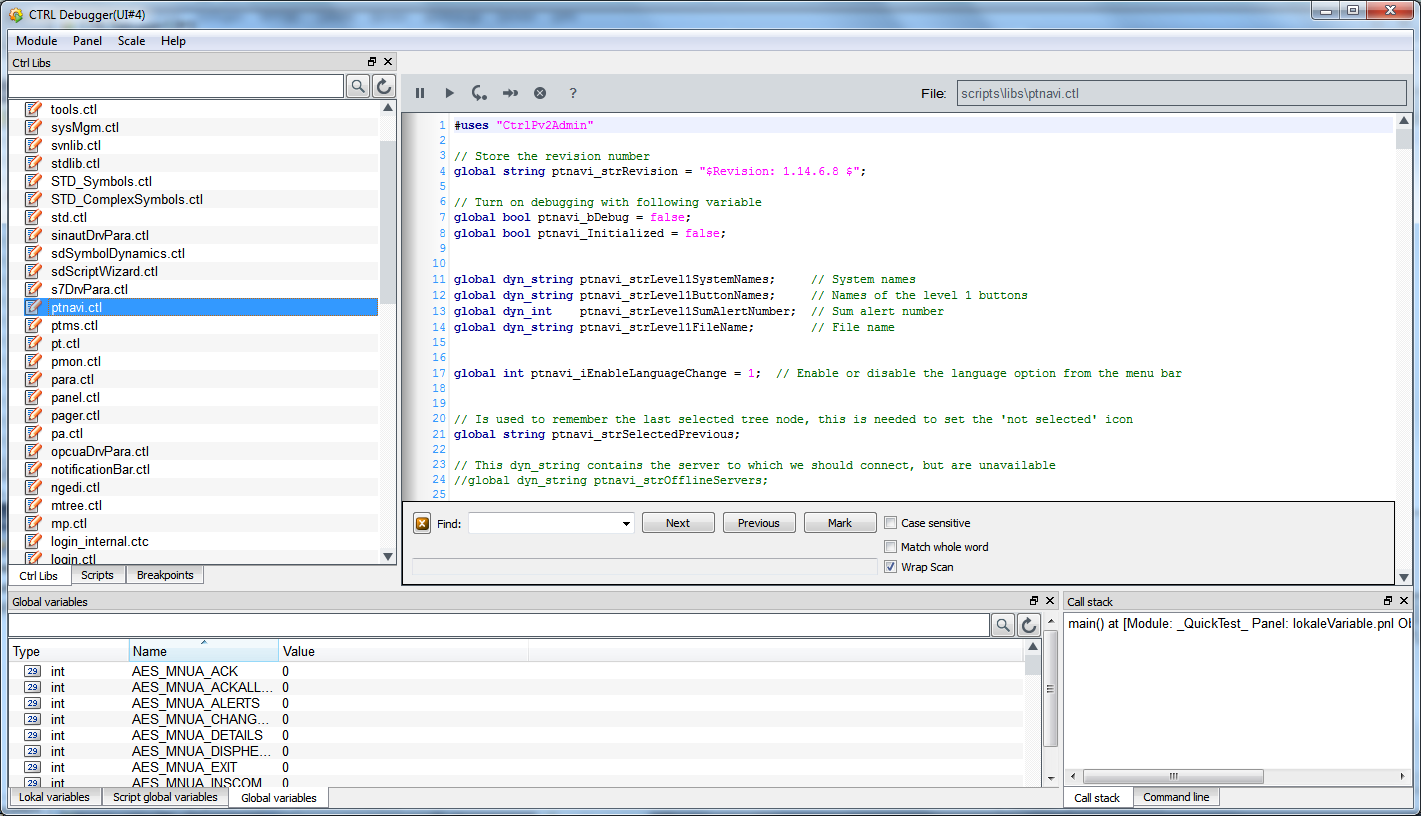
The panel contains 5 main areas that are described in detail in the following:
-
The Window for CTRL libraries, scripts and breakpoints (left-hand side)
-
Window for variables - local variables, script local variables, global variables (at the bottom)
-
Help window for old commands under "Command line" and call stack (at the bottom right)
-
Info window (top right)
as well as the
Since the windows are DOC modules, these can be moved and placed freely.
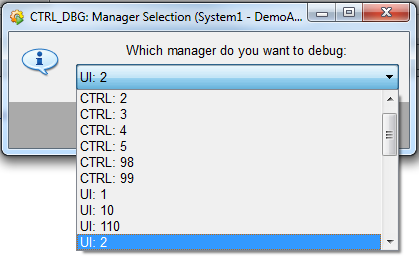
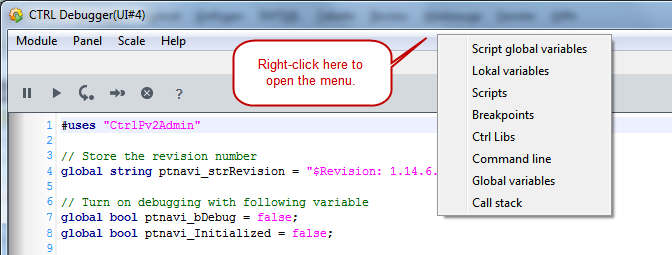
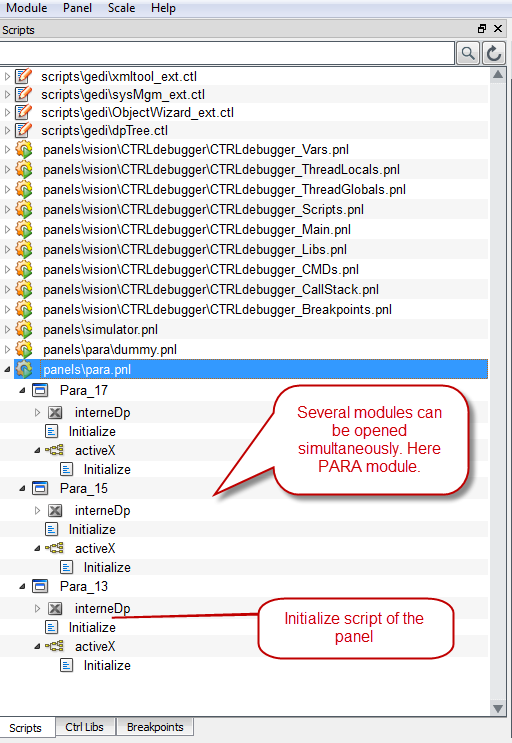
If all modules were closed, individual modules can be activated via right mouse click (see figure below):
If the user interface or the CTRL manager that should be debugged, does not run, an error message is shown in the main window:
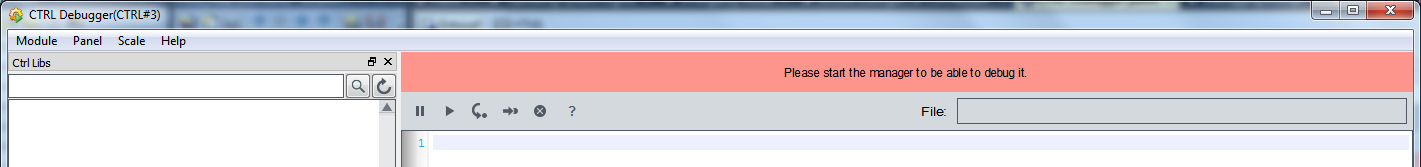
After the restart of a manager, all views of the debugger are updated.
Script Window
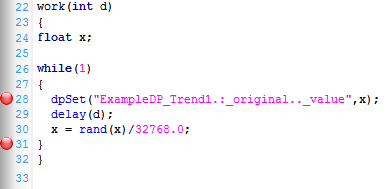
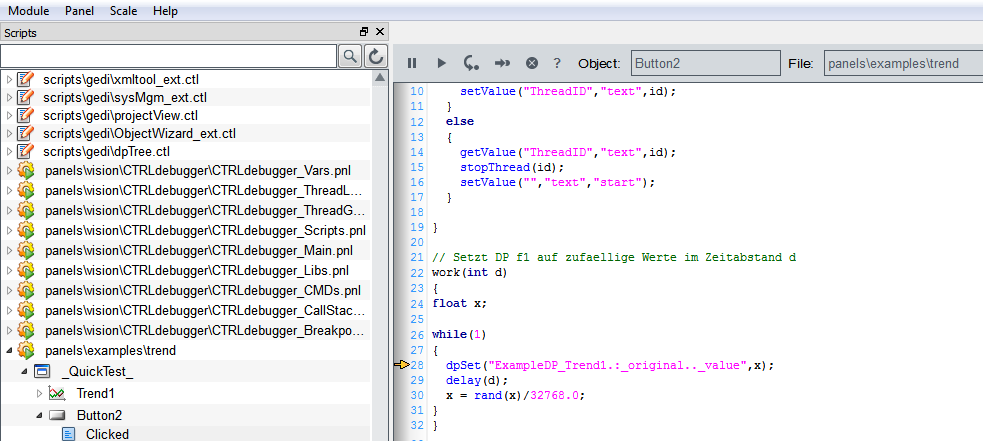
In the script window, scripts and CTRL libraries can be debugged. You can set breakpoints and execute scripts (see figure below). The buttons of the debugger are described further below.
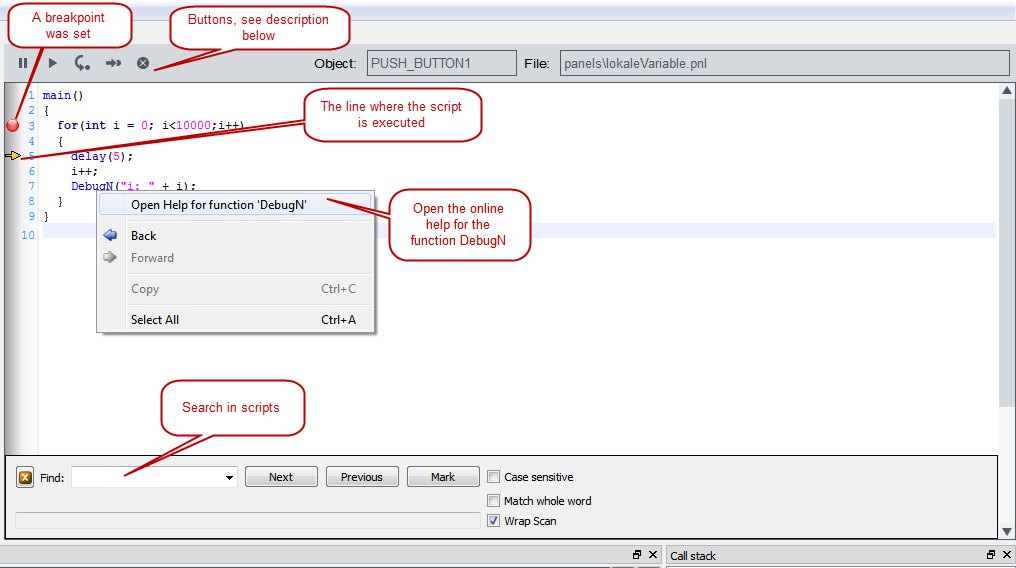
Buttons
Furthermore the panel contains the following buttons:
 Pauses the script. You can also use
the Pause, Break" button of the keyboard.
Pauses the script. You can also use
the Pause, Break" button of the keyboard.
 Continues the execution of the script
(Hotkey: F5)
Continues the execution of the script
(Hotkey: F5)
Jumps to the function that is currently executed or to the next line when the code that is executed does not contain a function (Hotkey: F8)
 Jumps to the current line (Hotkey:
F10)
Jumps to the current line (Hotkey:
F10)
 Deletes all breakpoints (Hotkey: Strg
+ F9). In the script window the F9 key sets a breakpoint.
Deletes all breakpoints (Hotkey: Strg
+ F9). In the script window the F9 key sets a breakpoint.
 Opens the online help.
If the content of a script is not shown in the main window, the script is encrypted!
If the CTRL debugger is stopped, the last edited managers remain in their debug state, for example, stopped or single step mode. If a manager is restarted, the manager resumes to normal mode again.
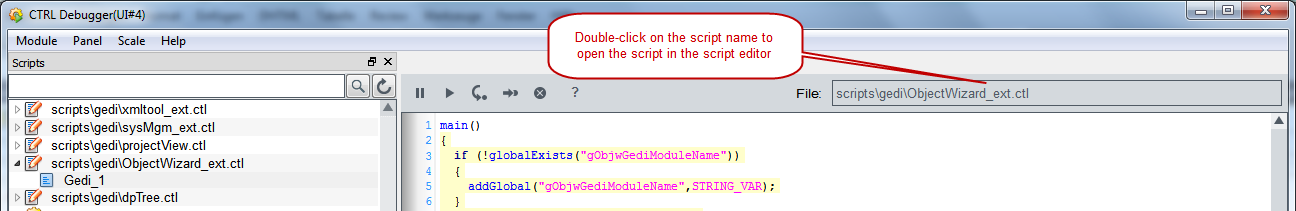
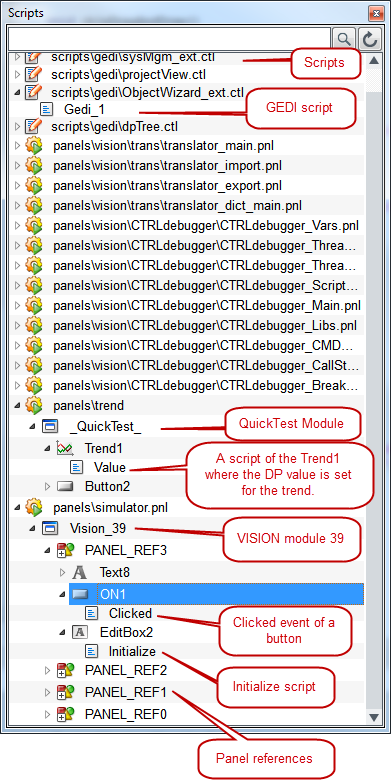
By clicking a script or a panel in a tree (see the figure "Scripts in the tree view"), the events of scripts, panels and graphic objects can be opened. For panel scripts the module name, the object name as well as the event name are shown under the panel name. A click on an event (see figure Scripts in the tree view) or a click on a library name (see figure CTRL libraries in the tree view) shows the code on the right in the main window. You can now debug the code. Use the buttons to debug the scripts. Note that the a script cannot be changed here. In order to change a script, double-click a script on the top right in the CTRL debugger window (see figure below) and the script is opened in the script editor. Edit the script in the original file. The same applies to panels, double-click a panel name in order to open a panel in the GEDI.
Ctrl Libraries, Skripte, Breakpoints
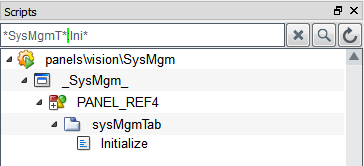
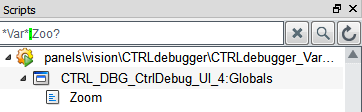
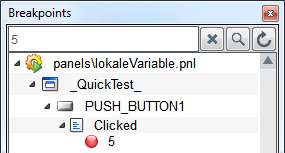
You can switch between "Ctrl Libraries", "skripts" and "breakpoints" via the tabs. The input field on the top left contains a search field (see figure below). Here you can search for scripts, CTRL libs or breakpoints. Individual letters can be used a search key. The key is searched in scripts, CTRL libs or breakpoints. All files where the key is found are shown. The * key after a letter searches for files that contain this letter. If you enter, for example, ca*, the debugger searches for files that start with the letter combination ca*. The search key *ca* searches for files where the letter combination "ca" is found. A question mark can be used for an arbitrary sign. This means that the search for ca? returns a result with ca + an arbitrary sign. Signs within square brackets replace one of the signs specified in the square brackets. Note also that the search is not case sensitive and that if you do not use a wild card, an asterisk * is added before and after the search key. Note that if you search in one of the lower levels, the colon :must be used as separator between the levels. See figure below.
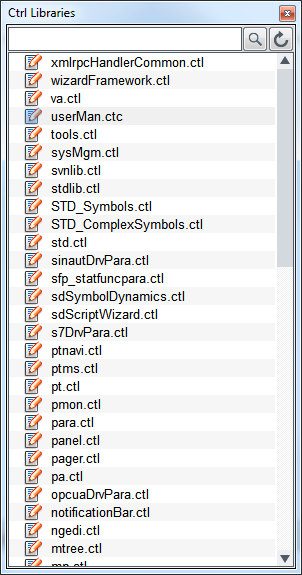
Ctrl Libraries
The Ctrl Libraries tab contains all Control libraries that are loaded (being used) for the current UI or CTRL manager (the manager that is debugged).
Scripts
Under Scripts, the scripts for panels of the current UI manager are shown.
The relative path is shown as a tooltip in the tree view.
Breakpoints
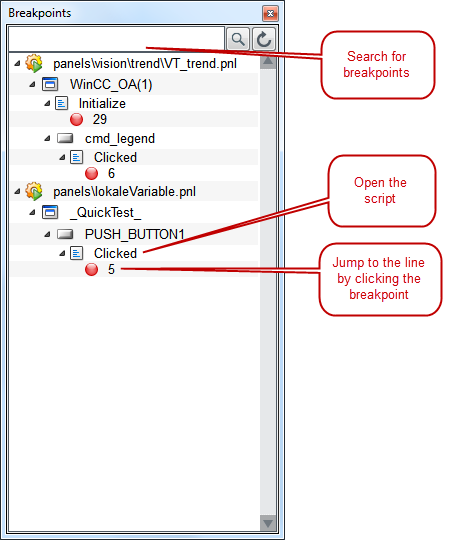
Breakpoints can be set on the tab of the same name. When a breakpoint is set, the
execution of a script stops where the breakpoint was set. Note that breakpoints are
shown only after updating the tree view  . The breakpoints are created according to line numbers, the breakpoint "29", for
example, means a breakpoint on the line 29. A click on the breakpoint jumps to the
line where the breakpoint was set. If the script is selected in the tree view (see
figure below), the first line of the script is selected.You can also search for
breakpoints. See description of the search function.
. The breakpoints are created according to line numbers, the breakpoint "29", for
example, means a breakpoint on the line 29. A click on the breakpoint jumps to the
line where the breakpoint was set. If the script is selected in the tree view (see
figure below), the first line of the script is selected.You can also search for
breakpoints. See description of the search function.
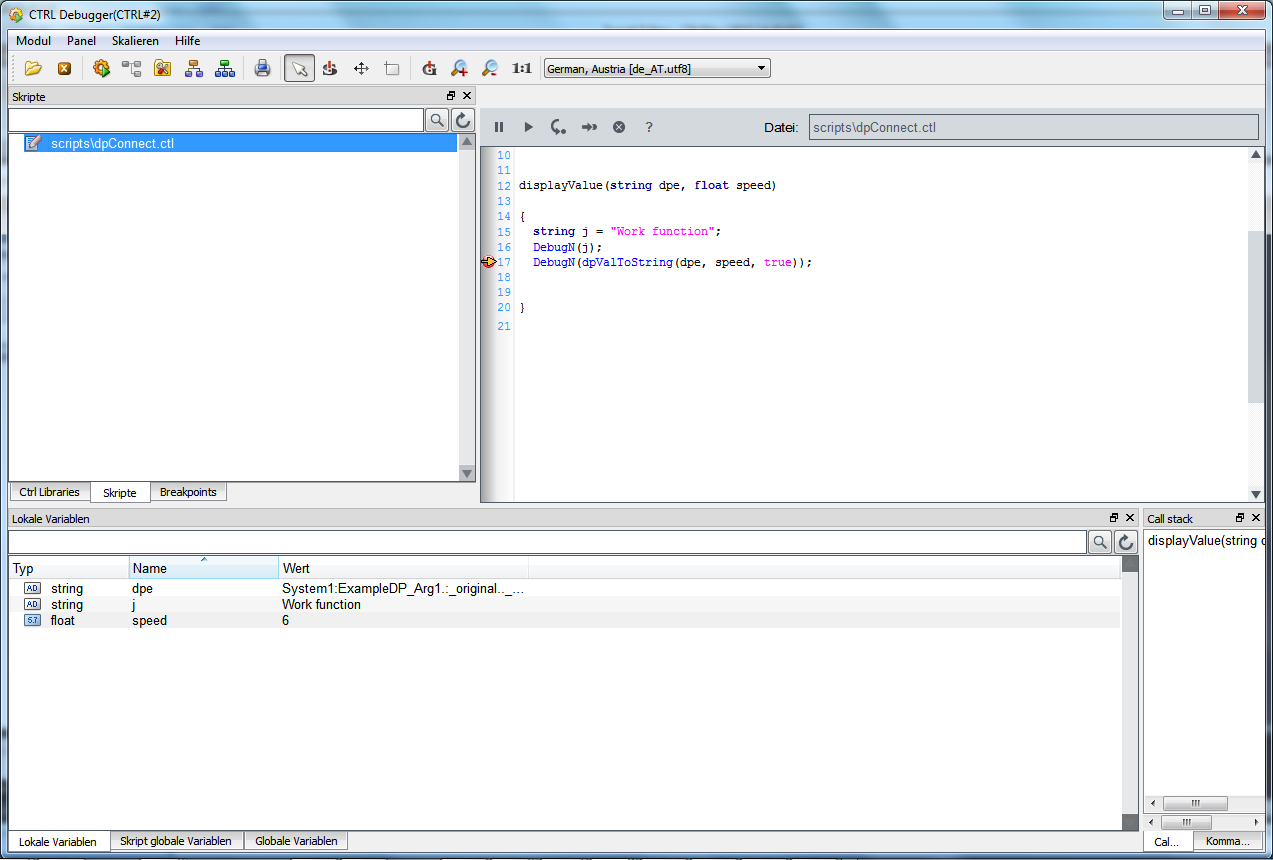
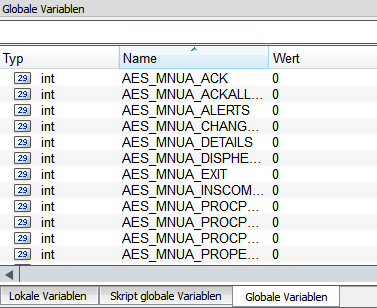
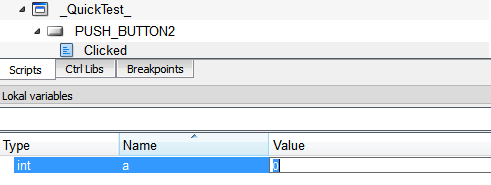
Local Variables, Script global Variables, Global Variables
At the bottom of the main panel, local variables, script local variables and global variables are shown. These can also be edited here. This means you can set values for the variables (see second figure below). Note that constants are not shown.
If you set new values for a script, for example, via PARA, click on the  update button in order to update the
values.
update button in order to update the
values.
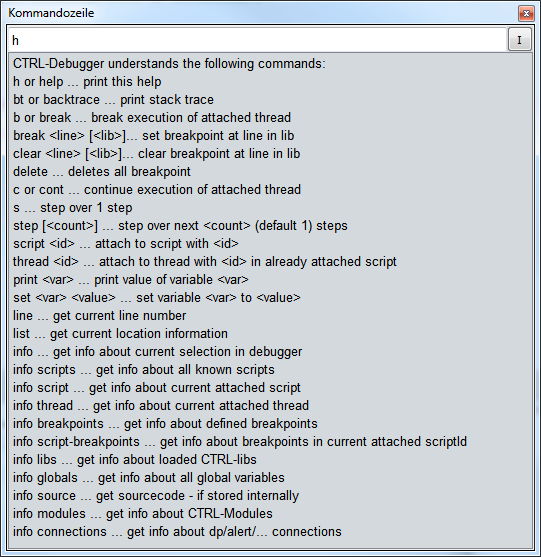
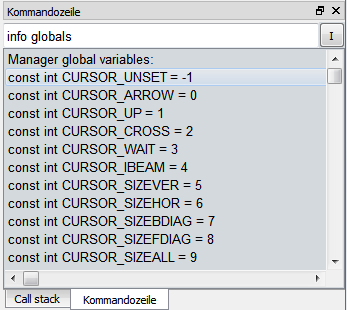
Command line
Down right in the panel, the old CTRL debugger commands and variables are shown. The variables are available for compatibility reasons. The commands can be used. Click on the I button or enter "h" into the input field and the commands are shown (see first figure below). Double-click the command and the command is shown in the input field and can be used.
Call stack
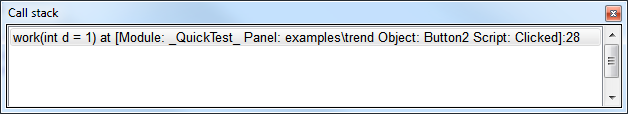
The Call stack window shows information about the script that is currently executed:
-
Which function is currently executed
-
On which line the script is currently executed
-
In which panel does the script run
-
The object for which the code was set (in case of a panel script)
-
In which module does the script run
In the following, a breakpoint was set for the function dpSet on the line 28 in the "clicked" event as well as on the line 31 of the button2 in the "trend" panel. The panel was opened via the QuickTest. This information is shown the call stack, i.e. the function that is currently executed, the module in which the panel was opened, the object for which the script was specified as well as the line where the script is currently executed.
Info window "File:"
In the info window, the name of a script or a panel is shown. On the left next to the panel name, the object name is shown, see the following figure:
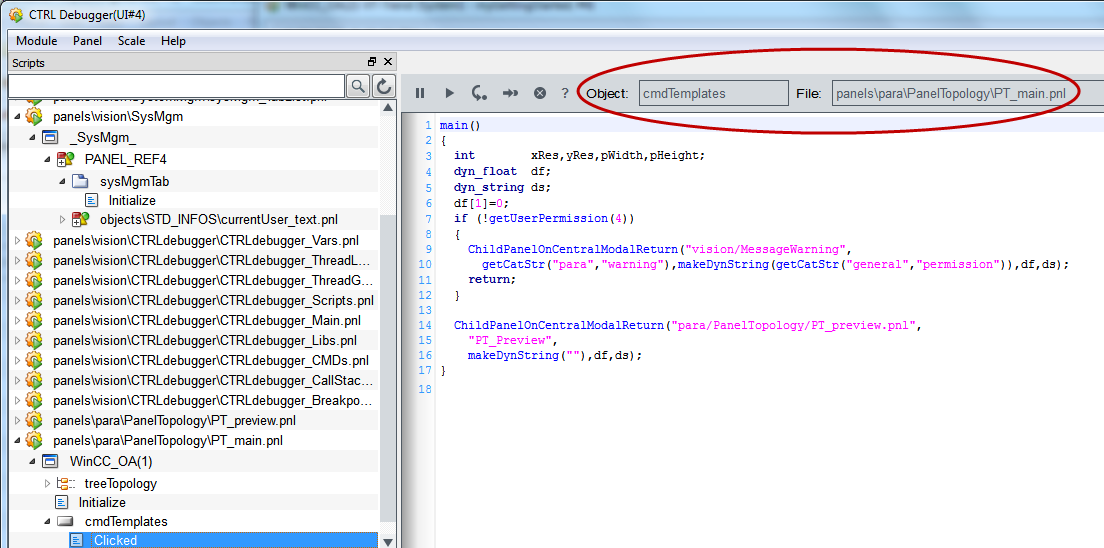
In order to edit a script, double-click a script on the top right in the info window of the CTRL debugger and the script is opened in the script editor. Edit the script directly in the original file. The same applies to panels, double-click on a panel name (see figure above) in order to open a panel in the GEDI.
If the CTRL debugger is stopped, the last edited managers remain in their debug state, for example, stopped or single step mode. If a manage is restarted, the manager resumes to normal mode again.
The chapter CTRL Debugger - Script Debugging Examples shows an example of debugging a script.


