CTRL Debugger - Script Debugging Examples
Normally scripts execute in fractions of a second, so it is often impossible to stop a script quickly enough after starting it with a click. You can, however, set a breakpoint. If you run the script again by using "Continue", it will execute up to the first breakpoint that you have set. In order to see all set breakpoints of a script, update the tree view on the Breakpoints tab. In order to debug a thread, set a breakpoint for a callback function of a script. This way you can debug Threads.
Trend
In the following example you will use the cyclic script of the example panel WinCC_OA_path/panels/examples/trend.
-
Open the panel in the Vision module and click on Start. Random numbers are set for the data point ExampleDP_Trend1 and displayed in a trend.
Figure 1. Trend 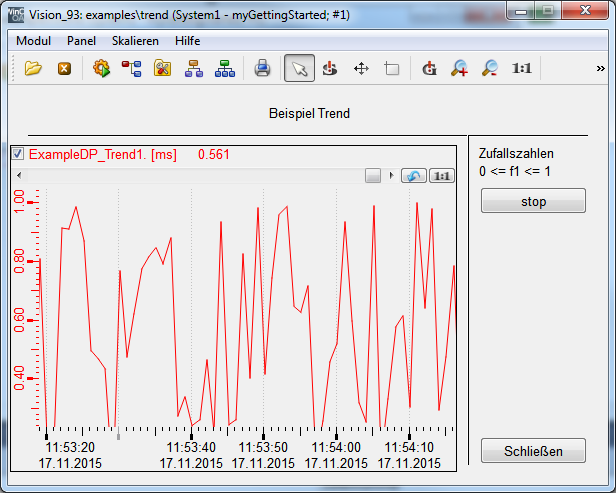
-
Open the CTRL Debugger for the manager UI_1 (or for another manager, depending on the manager you use) via the WinCC OA console or via the graphic editor
Figure 2. Select Manager 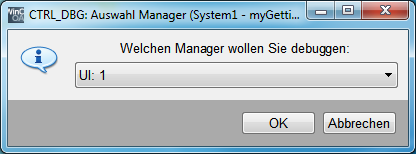
-
Click on the "Clicked" event of the panel "trend" in the tree view of the debugger.
-
Set a breakpoint on the row 28 (dpSet). The script is stopped. The trend curve is continued as a straight line.
Figure 3. A Breakpoint on the line 28 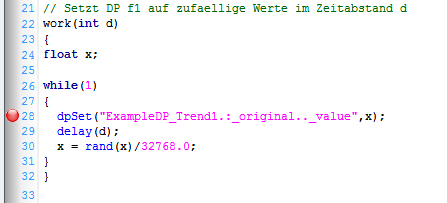
-
Click thereafter on
 or press
F5 in order to continue the script. The trend displays different values and
draws a curve.
or press
F5 in order to continue the script. The trend displays different values and
draws a curve. -
Click on the breakpoint to delete it and continue the script. The trend displays different values and draws a curve.
-
Click on
 to stop the script
and on to continue the
script. Use F8 for single step.
to stop the script
and on to continue the
script. Use F8 for single step.
Local Variables
The following example shows a script with a local variable.
-
Create a script in the graphic editor as shown in the figure below.
Figure 4. A script with a delay and a breakpoint 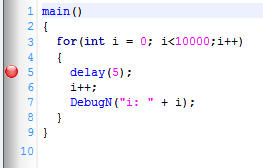
-
Set a breakpoint for the row 5. The values are not output since the breakpoint was set and the script is stopped.
-
Click on the
or F5 in order to
continue the script. Values are output.
Thread Debugging
In the following a thread is debugged
-
Create the following script in the graphic editor. Add the code, for example, to the "Clicked" event of a button.
Figure 5. A Script with a callback function (Thread). The arrow indicates that the event is being executed 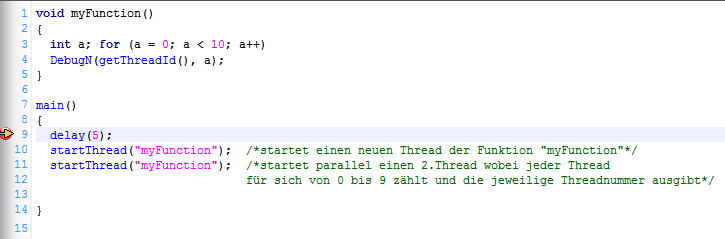
-
Open the panel in the module VISION. Click on the button with the code. The script is executed.
-
Open the CTRL debugger and set a breakpoint on the row 9. Click again on the button in module VISION. The function "myFunction" is stopped since the breakpoint was set. Click on the
to continue the script.


