
System Dashboard Access and Configuration
Access the System Dashboard directly from the Diagnostics area of System Management, and learn how to configure and customize it for your operational needs.
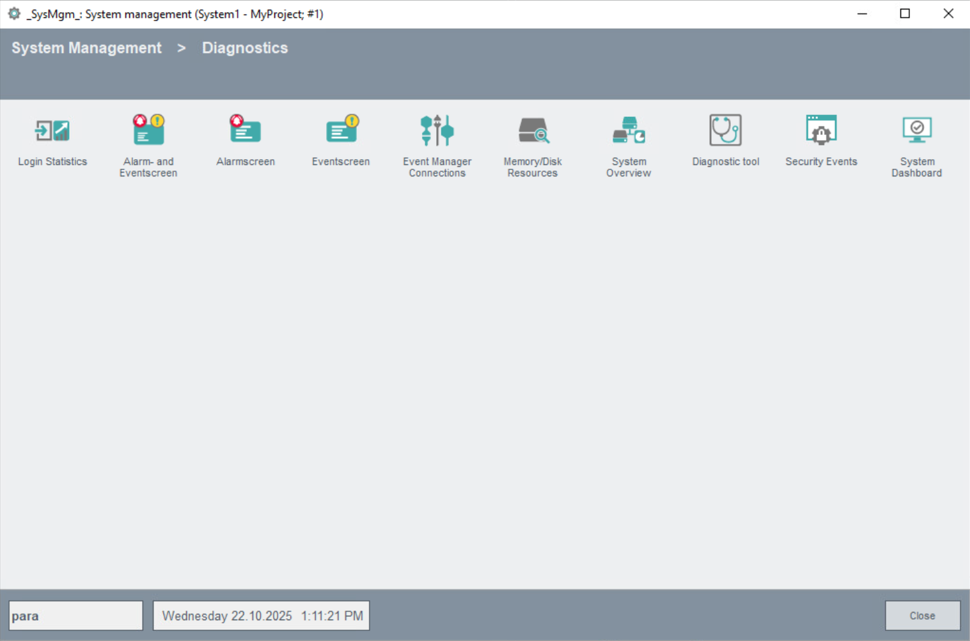
Accessing the System Dashboard
The System Dashboard can be accessed from your project by navigating to . In the System Management window, click the System Dashboard icon in the upper-right area.
The dashboard opens instantly and provides quick access to key performance and status indicators of your system.
Activation and Installation
The System Dashboard is usually enabled by default in new projects. If required, system administrators can manually add it during project setup or later via Node Manager.
Activation also takes place automatically during software updates.
In
standard projects , the Manager
system-dashboard/index.js is included by default. When
upgrading, you can automatically add this Manager by selecting the relevant checkbox
during the update process.
Alternatively, you may manually add it at any time by entering
system-dashboard/index.js in the Manager
Properties under Options.
Configuration Prerequisite: HTTP Server Setting
In your project's configuration file, ensure the following setting under the
[ui] section points to the correct address (host and port) for
your environment:
[ui]
                httpServer = https://your-server:port
In default projects, this value is usually set appropriately out of the box. You only need to modify it if you are using a custom host or port for your web UI.
httpServer must be manually edited since
version 3.21 to make the System Dashboard work correctly. There is no automatic
update of this value during registration, which is intentional because it is unclear
whether the change is due to a DNS update or a completely new hostname. Customization Options
- Widget selection: Choose which KPIs and widgets appear on your dashboard.
- Interface/network settings: Adjust settings as needed via the dashboard options.