
Performance KPIs
The Performance section of the System Dashboard monitors crucial runtime indicators—including CPU load, memory, disk usage, process activity, and alerts—providing instant diagnostics for your WinCC OA system.
Overview: Performance Widget
The Performance widget provides a real-time overview of resource consumption, bottlenecks, and utilization for the selected system and project instance. It visualizes key aspects such as alert status, CPU and memory use, storage occupancy, and running process health.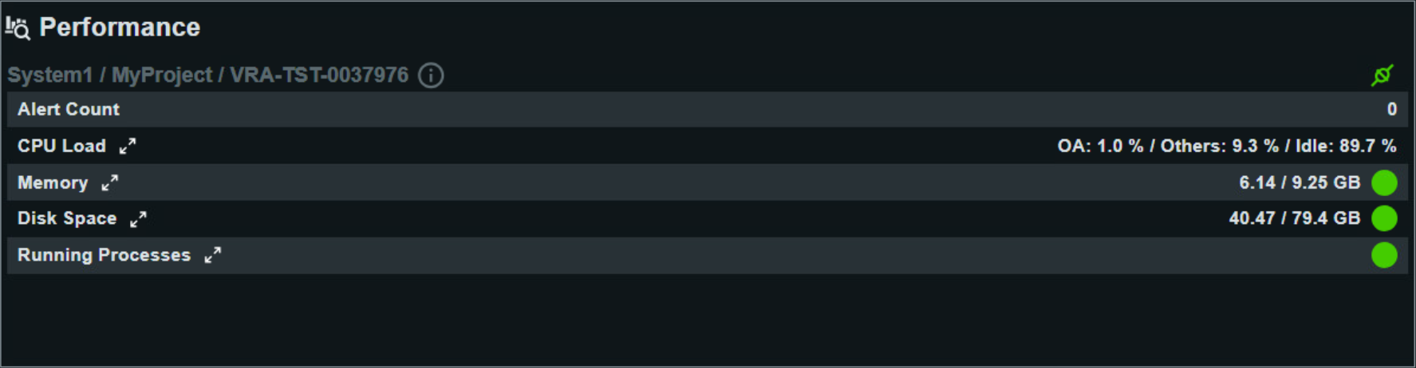
Detailed Performance KPIs
- Alert Count
- Reflects the current number of outstanding performance or system alerts. A count of 0 means there are no active warnings in this category, indicating a healthy system state. If the value is greater than zero, immediate attention to alerts is recommended.
- CPU Load
- Displays the overall processor load divided into three categories:
- OA: The proportion of CPU resources used by WinCC OA processes.
- Others: The CPU usage by other services or user applications running on the server.
- Idle: The percentage of CPU not currently in use, representing available processing capacity.
Note:This indicator represents the load across all CPU cores (total CPU load). - Memory
- Shows current RAM usage in relation to total available memory, for example 6.14 / 9.25 GB in use. The color/status indicator signals whether memory usage is within safe operational thresholds. Continuous high memory consumption may point to resource leaks or oversized applications and should be monitored.
- Disk Space
- Indicates the storage capacity in use versus the total available, such as 40.47 / 79.4 GB. Reliable disk capacity is vital for logging, database operations, and system performance. Low available space should be addressed proactively to prevent system interruptions.
- Running Processes
- Lists all active system and application processes directly related to WinCC OA. Each entry includes information such as process
name, process ID, parent process, start time, CPU and memory usage, and the
launch command. This detailed view is valuable for identifying problematic
processes, resource hogs, or abnormal activity.
Note:The value shown for CPU load per process (CpuLoad) always refers to a single core. If a process displays 100%, only one core is fully utilized by this process—not the entire CPU.