 "rulerValueLabelVisibility"
The attribute "rulerValueLabelVisibility" shows the curve value for the ruler of a trend curve.
Synopsis
setValue(string shape, "rulerValueLabelVisibility",int area, bool
                visible);
getValue(string shape, "rulerValueLabelVisibility", int area, bool
                visible);
shape.rulerValueLabelVisibility(int area, bool visible);
Parameter
| Parameter | Description |
|---|---|
| area | The index of the trend area for which the curve values are shown. |
| visible |
1 = The curve value is shown for the ruler of a trend curve 0 = The curve value is not shown for the ruler of a trend curve |
Description
The attribute "rulerValueLabelVisibility" shows the curve value for the ruler of a trend curve.
In order to use rulers, set the config entry "trendEnableCurveRulers" in the [ui] section of the config file. You can set rulers by clicking a curve. You can, however, also use the attribute "curveRulers"
Via the attribute "maxRulerCount" you can specify how many rulers can be used for a trend area.
 Example
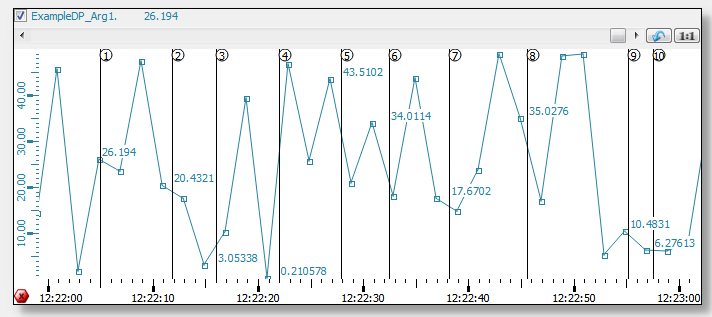
The following example shows the curve value for the rulers of the first area (area 0) of the trend.
main()
{
  TREND1.rulerValueLabelVisibility(0,1);
}

Use the attribute "rulerTimeLabelVisibility" to set the times.
Assignment
Trend