
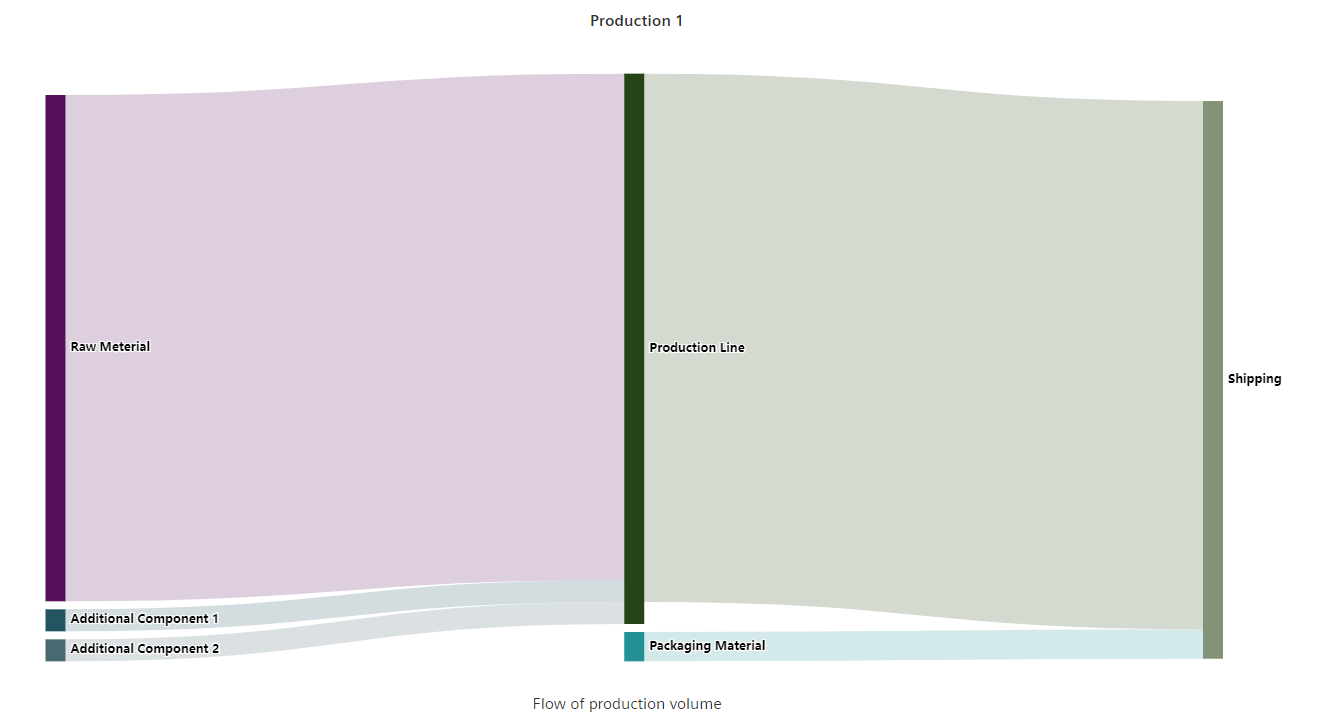
Sankey Chart Widget
The Sankey Chart Widget provides an easy visualization of values as a proportional flow from one node to another.
Datatypes
| Datatype | Supported? |
|---|---|
| int | ✓ |
| uint | ✓ |
| float | ✓ |
| long | ✓ |
| ulong | ✓ |
| string | ✗ |
| char | ✗ |
| bool | ✗ |
Settings
The nodes that act as fixed points between the flows can be named in all project languages and colored via a color selector.
The data flows are established as links from a starting node to an end node and will be proportional to the values of the associated data sources.
The Nodes can be aligned "right", "left" or "justify". The entire graph can be shown in either horizontal or vertical orientation. A focus can be applied when hovering with the mouse. The options for this are "none", "self", "series" or "adjacency". The default value is "none".