
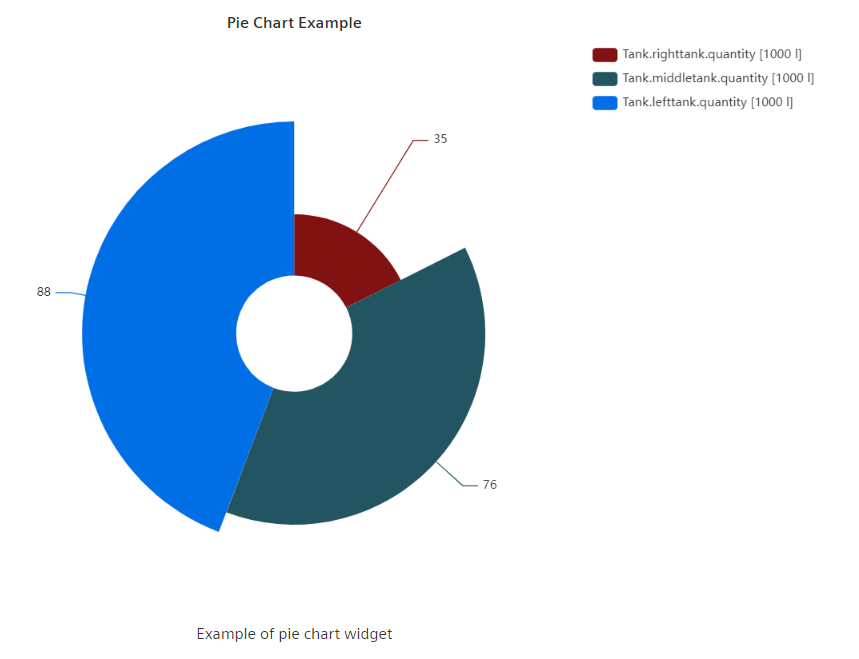
Pie Chart Widget
The Pie Chart Widget is useful for quick and clear visualization of data distribution though larger or smaller segments.
Datatypes
| Datatype | Supported? |
|---|---|
| int | ✓ |
| uint | ✓ |
| float | ✓ |
| long | ✓ |
| ulong | ✓ |
| string | ✗ |
| char | ✗ |
| bool | ✗ |
Settings
The pie chart can be shown as one of four chart types. The desired type is selected via the corresponding radiobox. The radius of the chart can be set with the slider below. For Nightingale charts the "Rose Type" can be set to "Area" and "Radius". In this case "Area" alots each segment a sector of the same size and displays the proportion of the value only by the thickness of the segment. In contrast, "Radius" displays both the sector and the thickness proportional to the value.
The corresponding tooltip for the values can be deactivated with a checkbox.
The description for each Segment can be deactivated or shown inside, outside or in the center of the Segment. The description can be either "Name", "Value", "Percentage", "Name and Value" or "Name and Percentage".
The legend can be displayed in an arbitrary corner of the Widget and can be grouped horizontally or vertically. For each value series the name and description can be imported from the related data point or set manually. A specific color can be set manually. The format for the value can similarly be imported or set manually. The corresponding unit can also either be imported or set manually. When setting it manually, an overview of SI units is available for selection.