
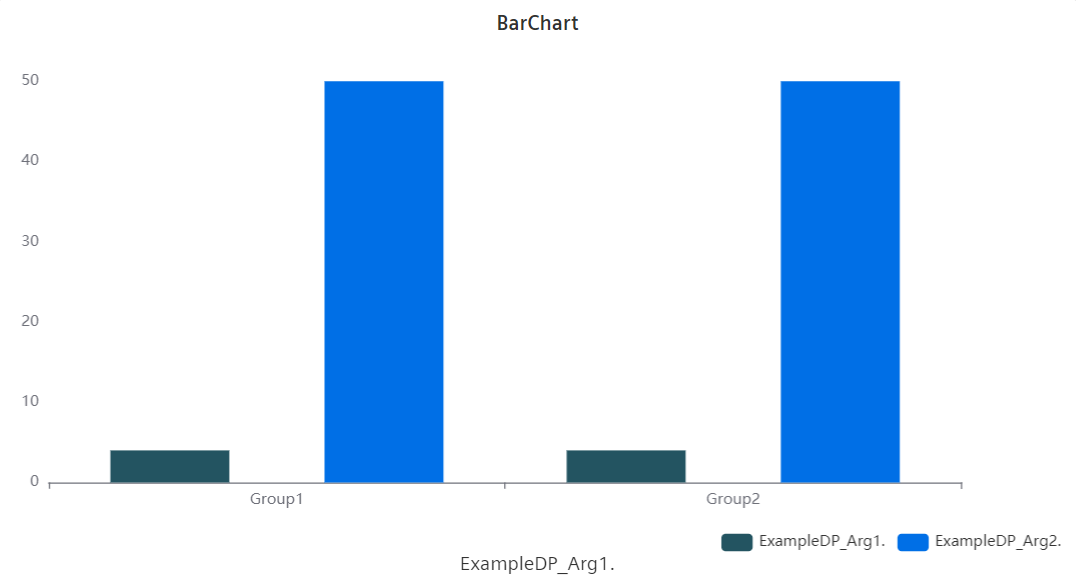
Bar Chart Widget
The Bar Chart shows the values of one or more datapoints and datapoint groups as bars.
Datatypes
| Datatype | Supported? |
|---|---|
| int | ✓ |
| uint | ✓ |
| float | ✓ |
| long | ✓ |
| ulong | ✓ |
| string | ✗ |
| char | ✗ |
| bool | ✓ |
Settings
- Datapoints
- The user can add multiple datapoints to the Bar Chart, each as a separate series of values.
- Formatting
- Different colors and descriptions can be set for each individual datapoint series and will be shown in the legend. The value format and the unit are set manually, inherited from WinCC OA, or deactivated. The unit can be manually chosen from an overview of SI units. The separate series can be grouped together. Multiple groups can be placed beside each other in the graph.