Dashboard
A widget-based web application for real-time monitoring, visualization, and interaction with WinCC OA project data.
The Dashboard is an application built on the WebUI Runtime framework. It uses the same technology stack including Lit Web Components, the Siemens IX design system, and the OaRxJsApi for real-time datapoint connectivity.
At its core, the Dashboard is built on the concept of Web Components, which are reusable, encapsulated HTML elements based on standard browser APIs. This approach enables the creation of modular widgets, that can easily be customized to suit a wide range of use cases.
The Dashboard’s layout system is designed for maximum flexibility. Users can freely arrange elements on the dashboard surface, creating custom views that reflect their operational priorities. Features like widget duplication and import/export functionality streamline engineering workflows, enabling both fast configuration and reuse of elements.
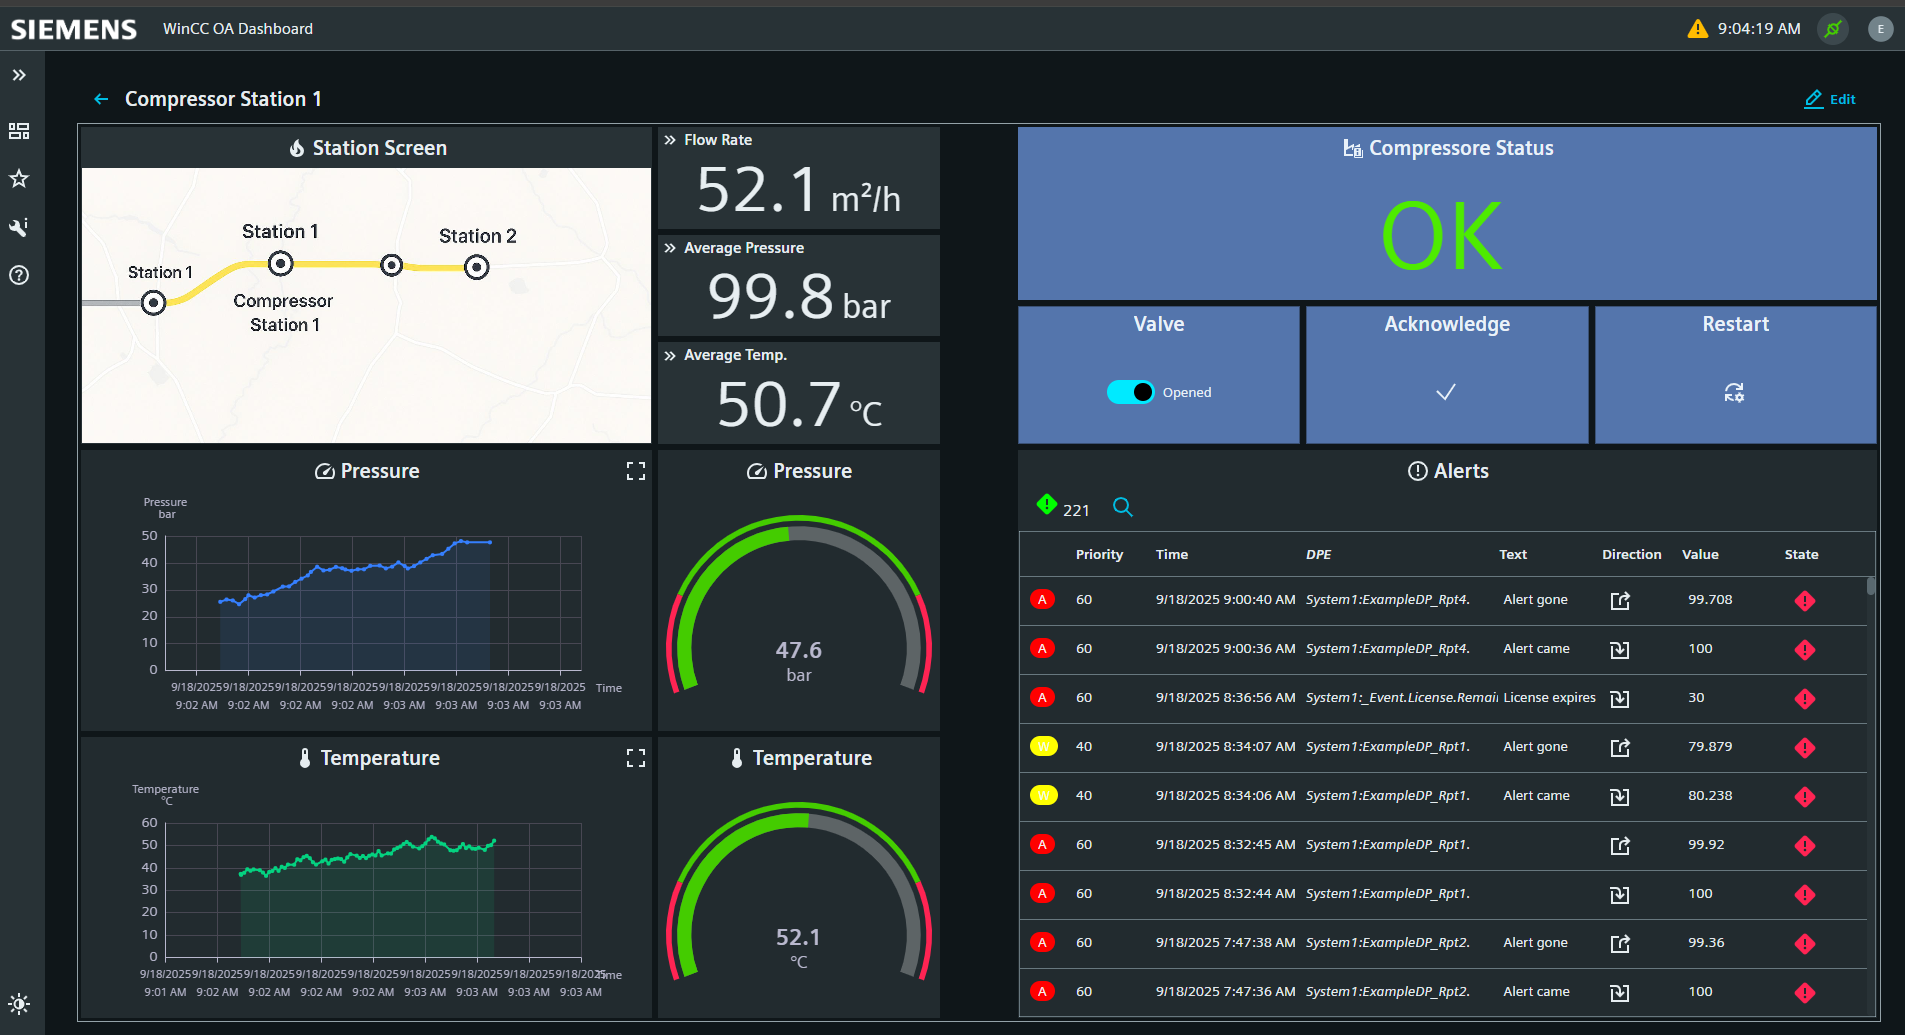
A key strength of the Dashboard lies in its library of widgets, which cover a broad spectrum of visualization and interaction needs. Standard widgets include bar charts, line charts, progress bars, KPI lists, images and more. Command widgets such as input fields, switches, set points, and sliders empower authorized users to interact directly with their systems, setting values and triggering actions from within the dashboard itself.
Under the hood, the Dashboards architecture ensures robust and efficient communication between the browser-based UI and the WinCC OA backend. A WebSocket server handles commands and data access, and a shared worker and context component manage data retrieval, configuration and event handling. Settings pages and widget descriptions are defined in JSON, allowing for clear and easy extensibility.