
Example: Smart City Dashboard
This example illustrates how to use the WebUI Runtime to build a multi-page web application with live datapoint connectivity, alarm handling, trend visualization, and custom branding.
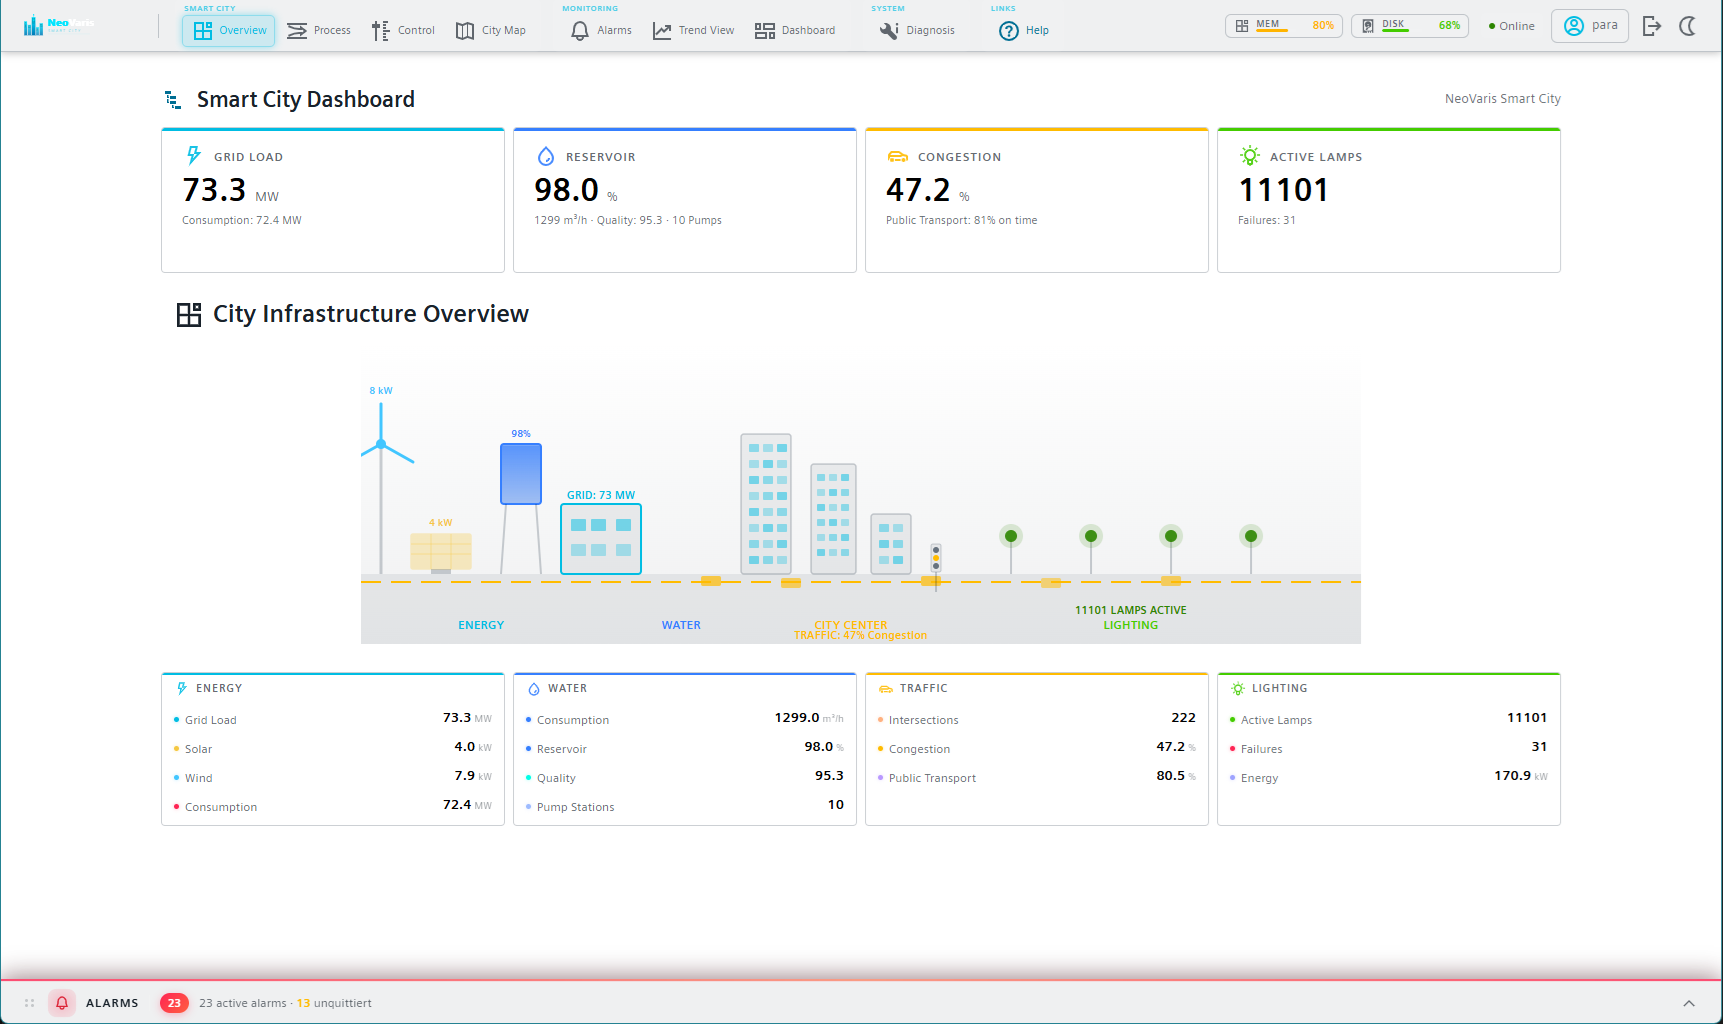
The NeoVaris Smart City Dashboard is a reference implementation that demonstrates the capabilities of the WebUI Runtime. It is a Web SCADA frontend built with Lit 3 and OaRxJsApi. The application consists of several standalone pages that each serve a different purpose: a KPI overview with hero cards and an SVG city visualization, a full-screen SCADA process diagram, a control page with slider-based dpSet interaction, an interactive Leaflet map, an alarm table with filtering and acknowledgment, historical trend charts, and a system diagnosis page. Together, these pages cover the most common patterns encountered when building WebUI Runtime applications.
Project structure
The project follows the standard WebUI Runtime workspace layout. Application configuration files reside in apps/dashboard-wc/config/, including appconfig.jsonc for branding settings and menuconfig.jsonc for navigation and routing. Standalone page source files are located in libs/default-components/src/lib/standalone-pages/, where each page is a self-contained Lit component in a single TypeScript file. Static assets such as logos and SVG backgrounds are stored in libs/default-components/src/assets/ and mirrored to apps/dashboard-wc/public/assets/ for runtime access.
Connecting to datapoints
Each page obtains a reference to the OaRxJsApi
service through dependency injection and subscribes to datapoints in its
connectedCallback() lifecycle method. The following
abbreviated example shows the pattern used throughout the Smart City
pages:
const oaRxJsApi = container.resolve<OaRxJsApi>(OaRxJsApi);

// Subscribe to a live datapoint value
const subscription = oaRxJsApi
  .dpConnect('System1:SmartCity.Energy.GridLoad', true)
  .pipe(map((data) => (data.value[0] as number) ?? 0))
  .subscribe((value) => {
    this.gridLoad = value;  // triggers re-render via @state()
  });

// Write a value back to the process
oaRxJsApi.dpSet(['System1:SmartCity.Energy.GridLoad'], [75.5])
  .subscribe();
Datapoint names in the browser always require the
System1: prefix. Subscriptions are collected in an array
and cleaned up in disconnectedCallback() to prevent memory
leaks. The @state() decorator on the receiving property
ensures that the component re-renders automatically when new values
arrive.
Alarm integration
The alarm page subscribes to alerts through the
AlertService provided by the Dashboard models library. It
displays incoming alerts in a sortable and filterable table. Operators can
acknowledge individual alarms directly from the table by writing to the
_alert_hdl.._ack config of the corresponding datapoint.
A collapsible alarm bar at the bottom of the application shell shows a
live summary of active alarms on all other pages and pulses with a red glow
when unacknowledged alarms are present.
Trend charts
Historical trend visualization is implemented using the
wui-widget-trend widget through the
wui-context-generator. Each trend series is configured
with a datapoint name, a time range (for example,
-1h for the last hour), and display options such as line
color, style, and an optional dedicated Y-axis. The
Siemens IX ECharts integration provides interactive
features like tooltips, zooming, and a range picker.
Map view
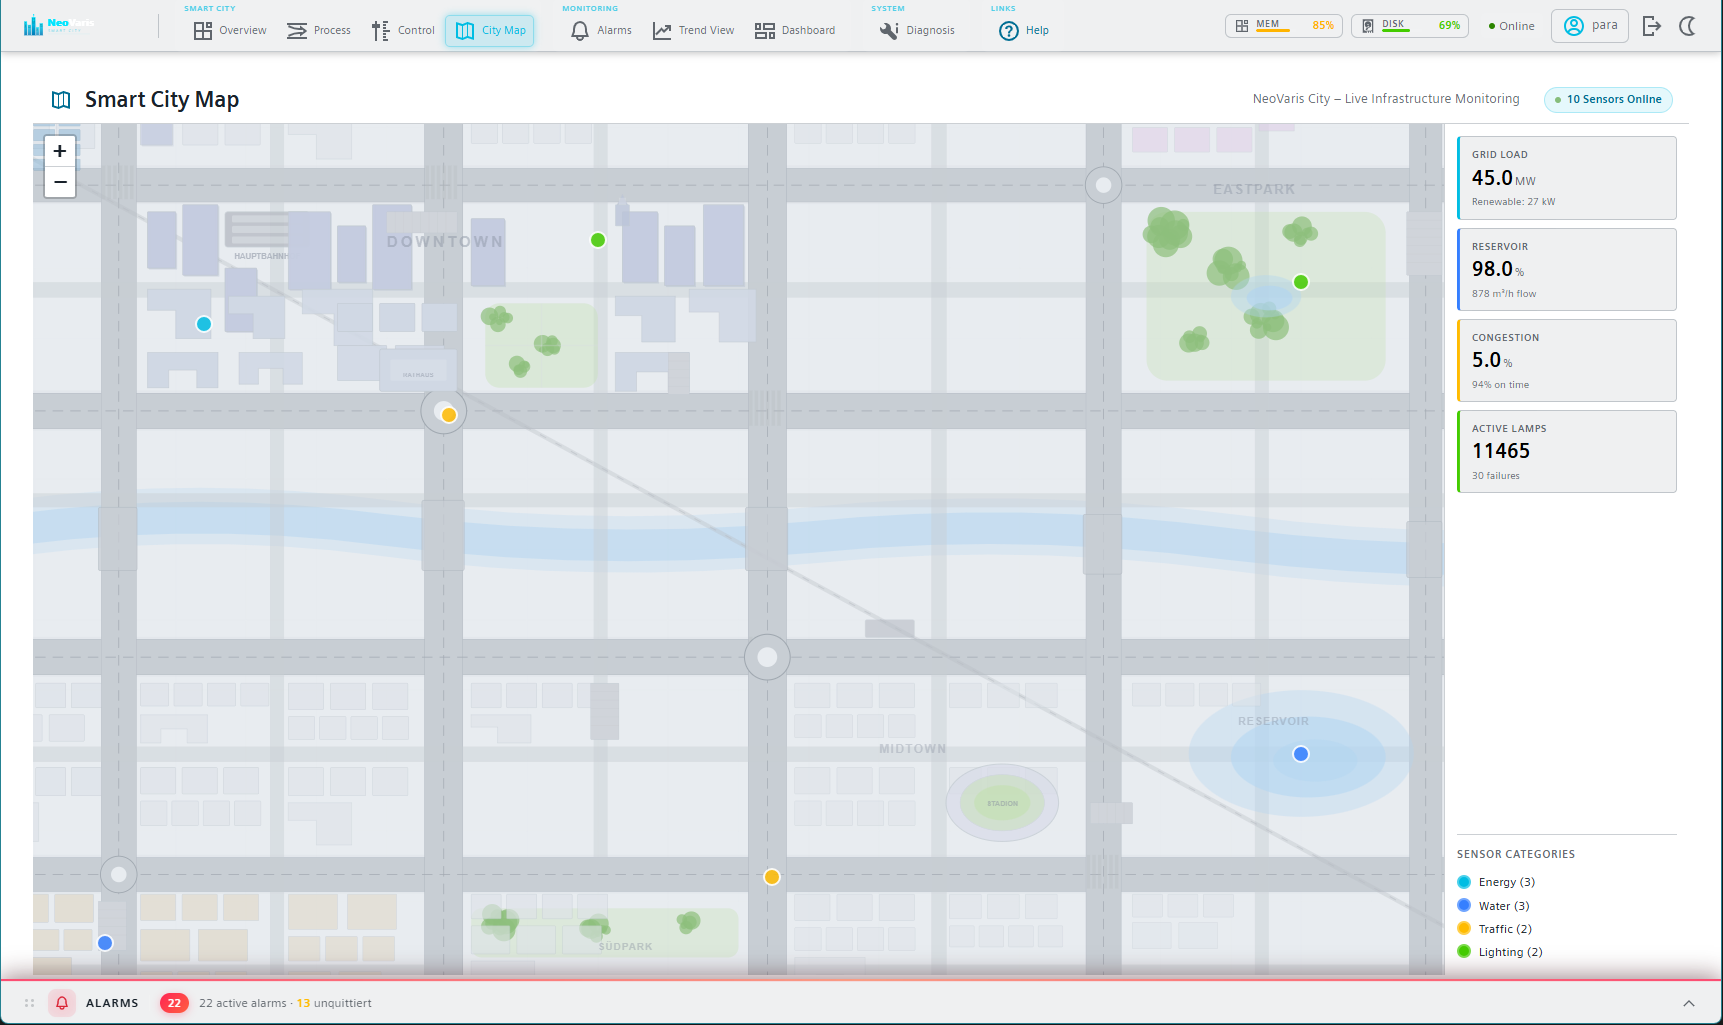
The interactive city map uses the Leaflet library with
L.CRS.Simple pixel coordinates instead of geographic
projection. An inline-generated SVG of the city layout is rendered as a
Leaflet SVG overlay. Sensor markers are placed at defined coordinates and
update their color based on live datapoint values. This approach avoids
external tile server dependencies, which is important because the
webserver.js enforces a strict Content Security
Policy that blocks external resources.
Branding
The Smart City Dashboard demonstrates custom branding by replacing the
default logo with a project-specific SVG, setting a custom application
title in appconfig.jsonc, and defining a cyan accent
color (#00bde3) through the
--neo-accent CSS variable. The login screen uses a
custom SVG background. A dark/light mode toggle in the header switches the
theme at runtime.
Build and access
After development, the application is built by setting the
OUT_DIR environment variable to the
data/dashboard-wc/ directory of the target
WinCC OA project and running
npm run build. The build pipeline generates the shared
bundles, compiles all standalone pages, and copies assets to the output
directory. The deployed application is then accessible at
https://<host>:<port>/data/dashboard-wc/index.html.