Control Code Coverage & Performance measurement
The Control Code Coverage and Performance measurement provides additional information for analysis of the executed code.
With the Control code coverage you can:
-
detect which code parts of scripts and libraries have been executed
-
detect the ratio of "covered lines" versus "not covered lines" of the total number of lines.
-
count how often a statement was executed
-
load coverage data directly into the CTRL script editor to visually see the results
With the Performance measurement you can:
-
see the amount of time spent for each function
The information described above is written to an XML file when the corresponding report flags or manager options are activated for a CTRL manager. In other words a coverage report is created.
Which report flags and manager options can be used and how to activate them is described in the following:
Report flags/Manager options for the CTRL Coverage
The following table contains the report flags and manager options for CTRL coverage:
| Flag | Description |
|---|---|
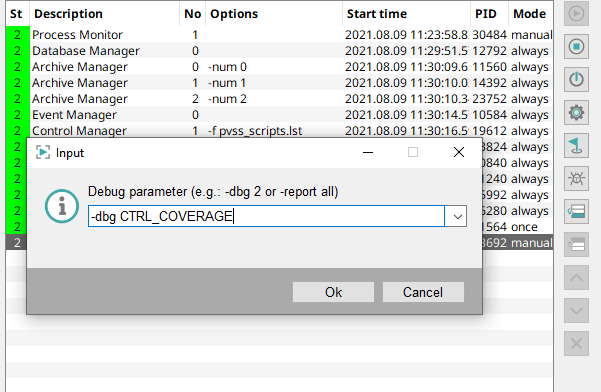
| -dbg CTRL_COVERAGE
-dbg CTRL_PERF |
When -dbg CTRL_COVERAGE or -dbg CTRL_PERF is active on Manager start, an output file is created and will continuously be filled when data needs to be written (e.g. a thread ends or a script is stopped or when the manager finishes). For more information, see CTRL Coverage Output. |
|
-report CTRL_COVERAGE |
To dump performance/coverage data, use -report CTRL_COVERAGE When dumping current data, all internal counters are reset to 0. |
| -coveragereportfile <filename> |
Specifies the coverage output file (XML format). The -report CTRL_COVERAGE flag writes the CTRL code coverage information into this coverage output file (see examples in the table below). If an existing report file should not be overwritten, use the following place holders. If the name of the report coverage file contains these place holders, they are replaced as follows: $DATE$ ==> yyyymmdd $TIME$ ==> HHMMSS $MAN$ ==> Managername |
| -report RESET | This option is used to reset coverage and performance counters to 0, without dumping the current state. |
The following table shows how to use the debug flags and manager options:
| Flag | Description |
|---|---|
| -dbg CTRL_COVERAGE | Writes the code coverage information to a manager log file. |
| -dbg CTRL_COVERAGE -coveragereportfile coverage_$DATE$_$TIME$_$MAN$.xml | Writes the code coverage information to the specified coverage output file, e.g. coverage_20161005_091309_WinCC OActrl2.xml. See also place holders in the table above. |
-
To output the coverage data for panels, use the report flag -report CTRL_COVERAGE.
-
Coverage information of a panel will be saved correctly in an XML file. The script editor, however, cannot read a panel code coverage report. The script editor can only read code coverage reports for libraries and scripts but not for panels.
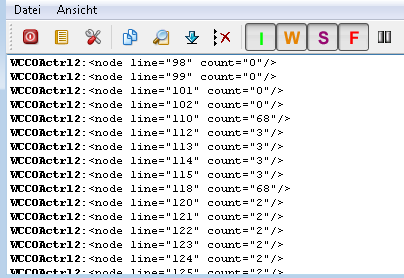
The code coverage information is written to a manager log file: WCCOActrl2.log for the Control manager with the number 2. The report is also output in the log viewer:
Performance Measurement
The performance measurement allows you to output performance data. The calculation and storage of performance data takes considerable use of resources, influencing runtime performance. As a consequence, the output performance data is only calculated if the debug flag "CTRL_PERF" is used.
The following table contains the possible report and debug flags:
| Flag | Description |
|---|---|
| -dbg CTRL_PERF [ -reportfile <filename>] |
Activates the performance measurement. When you specify the -reportfile <filename>option, the debug flag writes thread information to the specified performance report file. The file contains the thread data, for example: Note:
The data is saved in the XML format into the performance report file. The performance data can be read via other programs, or the Control Script Performance
Analysis Panel. |
| -report RESET | This option is used to reset coverage and performance counters to 0, without dumping the current state. |
The following table shows how to use the report and debug flags:
| Flag | Description |
|---|---|
| -dbg CTRL_PERF | Activates the performance measurement. |
| -dbg CTRL_PERF -reportfile coverage.xml | Writes the thread information data to the performance report file "coverage.xml". |
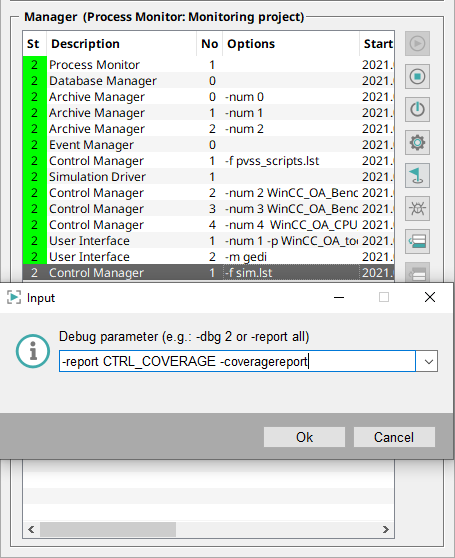
| -report CTRL_COVERAGE -coveragereportfile coverage_$DATE$_$TIME$_$MAN$.xml |
Set this report flag after setting the -dbg CTRL_PERF flag. The following performance data is written to the CTRL coverage report file "coverage_$DATE$_$TIME$_$MAN$.xml". interpreterTime - time in microseconds in the interpreter interpreterTimeDependent - time in microseconds inclusive called functions in the interpreter BlockedTime - respond time in microseconds (e.g. for a dpGet() answer) BlockedTimeDependent - as above, but inclusive called functions CallCount - number of calls during the performance measurement For more information on this CTRL Coverage report flag, see the description of the report flags for CTRL coverage in the beginning of this chapter. |
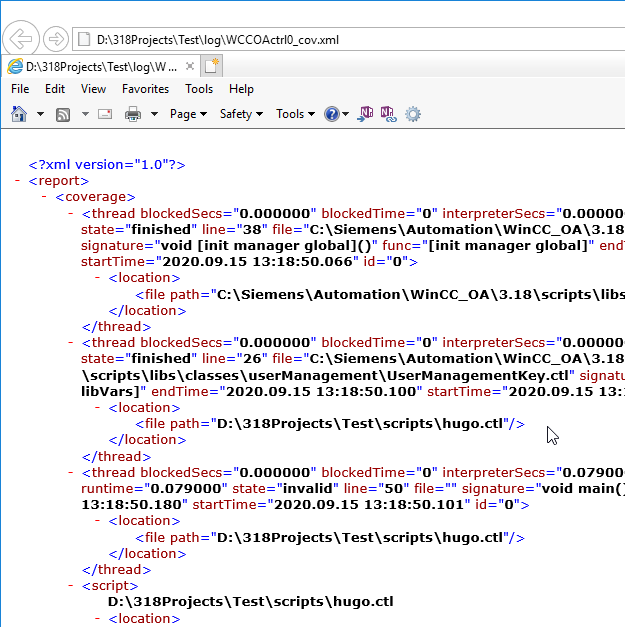
CTRL Coverage Output
When one of the report or debug flags -dbg CTRL_COVERAGE or -dbg CTRL_PERF is active on manager start, an output file is created and will continuously be filled when data needs to be written (e.g. a thread ends or a script is stopped or when the manager finishes).
The xml filename can be defined in the following ways:
-
Default: <manager><num>_cov.xml
-
Commandline: -coveragereportfile <filename>
-
Environment Variable: CTRL_COV_REPORT_STREAM
-
Config Entry: [allSections] coverageReportFile
<project path>/log-coveragereportfile subdir/coverage/fileName.xml<project>/log/subdir/coverage/fileName.xmlThe content of the report file will be deleted before a new code coverage report is written. In order to avoid this, use place holders (see the description of the place holders in the tables above).
Code Coverage via the CTRL manager after starting
When -dbg CTRL_PERF or -dbg CTRL_COVERAGE was active on manager start, the reporting and thus writing to the file is done continuously. Contrary to this, when they were not active at start (to only count a part of the execution), using -report CTRL_COVERAGE while the manager is running will create the report file at that point in time. However, the file will only contain data which is available at that point in time. That means that scripts already removed (e.g. from an already closed panel) will not be known.
The xml content will no longer be written to the manager log file/stderr or the file given with -reportfile <fileName>
The following steps produce a coverage report after starting a CTRL Manager:
-
In the WinCC OA console add a new CTRL manager, which loads a script (manager option: <nameOfTheScript>.ctl) to your project.
-
Start the CTRL manager.
-
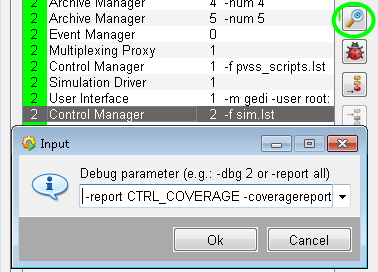
Press the key combination Ctrl+D in order to set the report flag:
-report CTRL_COVERAGE -coveragereportfile coverage_$DATE$_$TIME$_$MAN$.xml
for the CTRL manager.
-
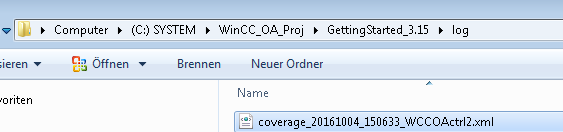
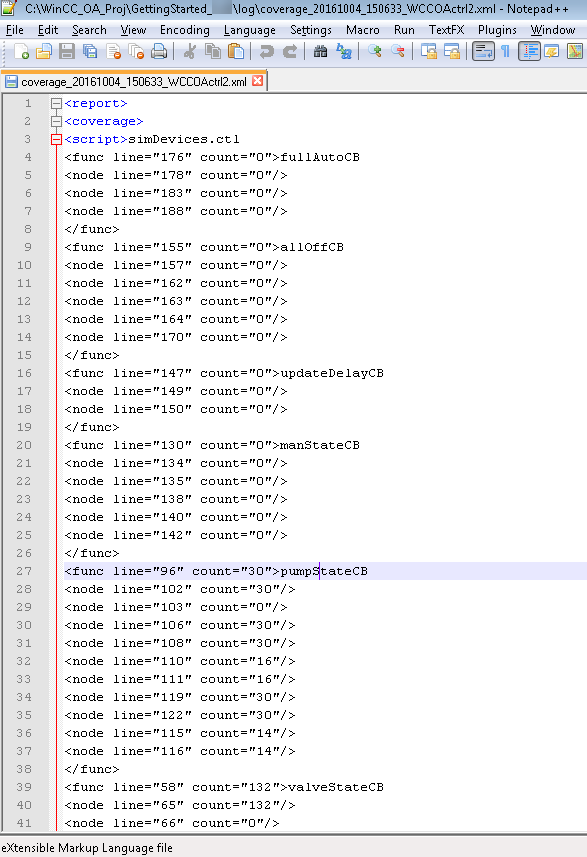
The report file is located in the log directory of the project and shows how often a statement was executed.
Control Coverage Report in the Script Editor
The Coverage Report can be displayed in the script editor alongside the code that was analyzed.
The following steps describe this process:
-
Open the script, which runs in the CTRL manager, in the script editor.
-
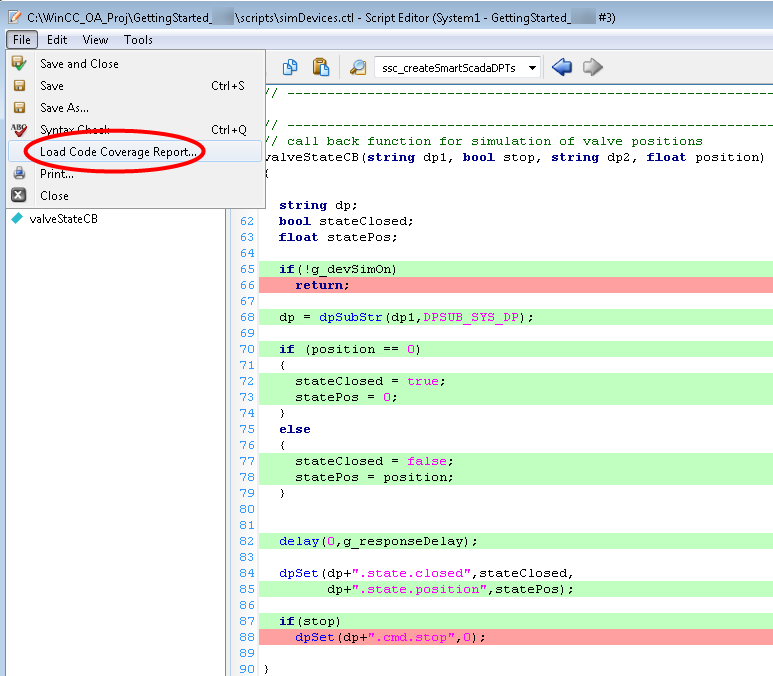
Load the code coverage report (Coverage file coverage_[date]_[time]_WinCC OActrl2.xml) via the Load Code Coverage Report option in the File menu of the script editor. The report is by default located in the log directory of the project.
-
The script is automatically shown with the corresponding marks in the script editor. The executed parts are marked green, the not executed parts red. You can delete the markers by using the option Remove Coverage Markers in the View menu .
Control Coverage report in the CTRL Script Performance Analysis Panel
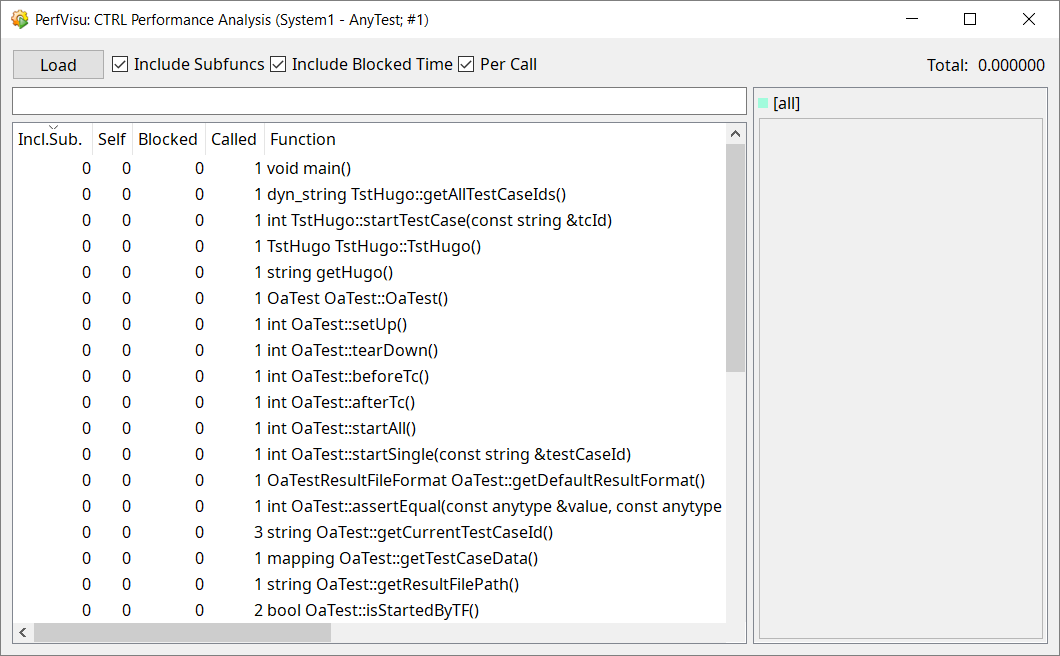
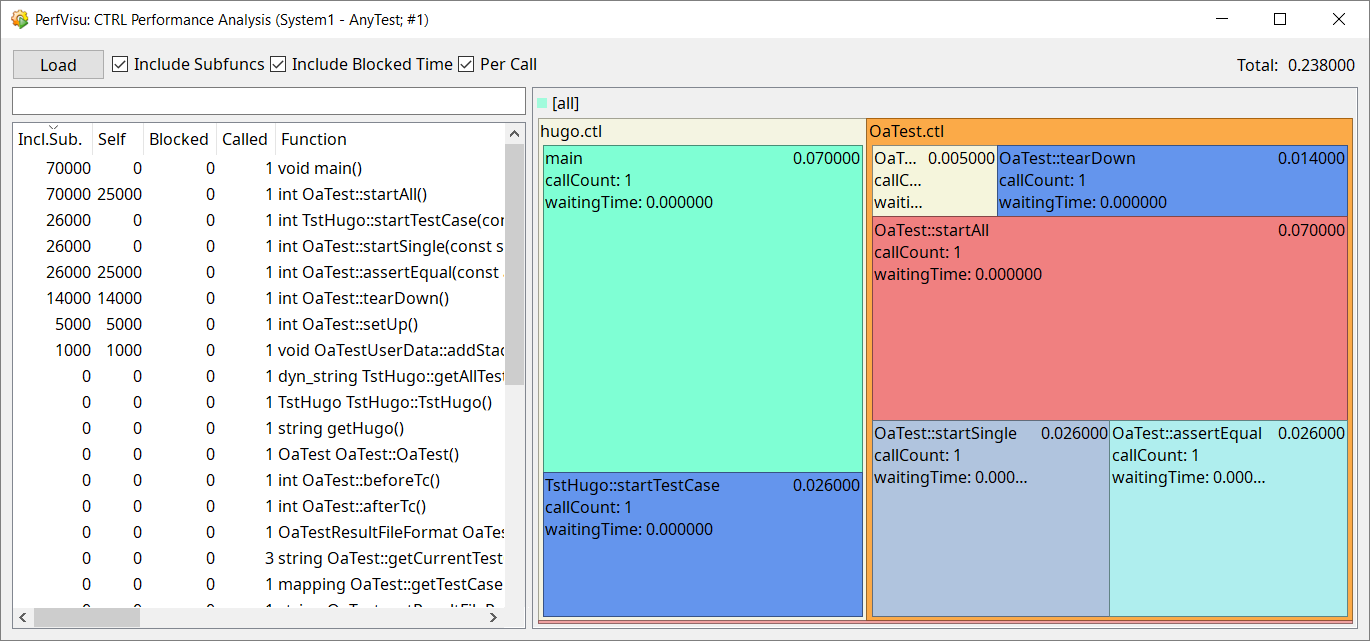
The Control Script Performance Analysis Panel (also called PerfVisu panel in the GEDI)
-
Go to the Tools- section in the GEDI and open CTRL Script Performance Analysis
-
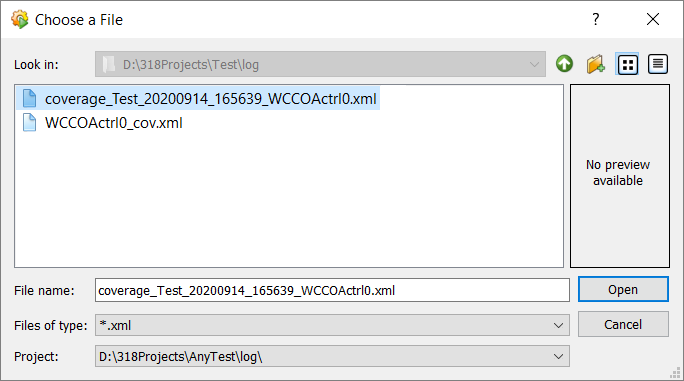
Click the Load button and select the script you want to display.
-
The Coverage or Performance Report is opened in the PerfVisu panel. The display can be filtered with the option- check boxes at the top.
XML Cobertura File Format
You can convert a WinCC OA XML coverage file to an XML in Cobertura file format.
shared_ptr<ICtrlCoverageConverter> converter = new CtrlCoverageToCoberturaConverter();
converter.convert(inputFileName, outputFileName);| Parameter | Description |
|---|---|
| inputFileName | Name of a WinCC OA XML Coverage file. This must be an absolute file name or the name can be queried via the function getPath(). |
| outputFileName | Name of the converted coverage XML in Cobertura file format. If the file exists, it will be overwritten. |
EXAMPLE:
string inputFileName = getPath(LOG_REL_PATH) + "WCCOActrl3_cov.xml";
string outputFileName = getPath(LOG_REL_PATH) + "WCCOActrl3_cov_Cobertura.xml";
You can convert all XML files of a directory ending with _cov.xml to Cobertura format. The converted files get the file name ending with
_cov_Cobertura.xml.
| Parameter | Description |
|---|---|
| path | Relative path of the directory where the XML files are located. |
EXAMPLE:
// Converting all COV files in log directory
shared_ptr<ICtrlCoverageConverter> converter = new CtrlCoverageToCoberturaConverter();
converter.convertAll(LOG_REL_PATH);