
Bar trend
The bar trend widget (see also Bar trend) is the basis for implementing a general panel for displaying dynamic arrays ("Dyn datapoints", see Datapoint types).
The bar trend "sum trend" in the DemoApplication (<proj_path>/panels/vision/bar_trend.pnl) is used to display the data point elements of the following data types:
-
dyn_int
-
dyn_uint
-
dyn_float
-
dyn_bool
These datapoint elements contain the values of the bar trend as one-dimensional arrays. In the diagram, the array index for the value is displayed along the horizontal axis and the value itself is represented by the bar height. All values originate from the same datapoint element with the same time stamps, so normally there is no temporal relationship.
Figure: Bar Trend in the DemoApplication
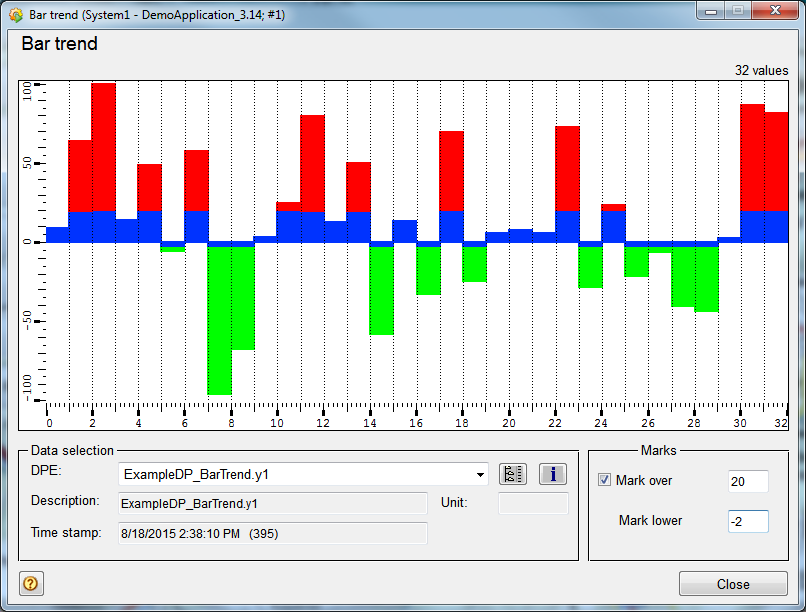
Select the datapoint elements either via the combo box (most recent datapoint elements used) or by entering the datapoint name directly. You can also select an element from a tree using the datapoint selector to the right of the combo box. The button with the blue "i" displays detailed information about the selected datapoint element.