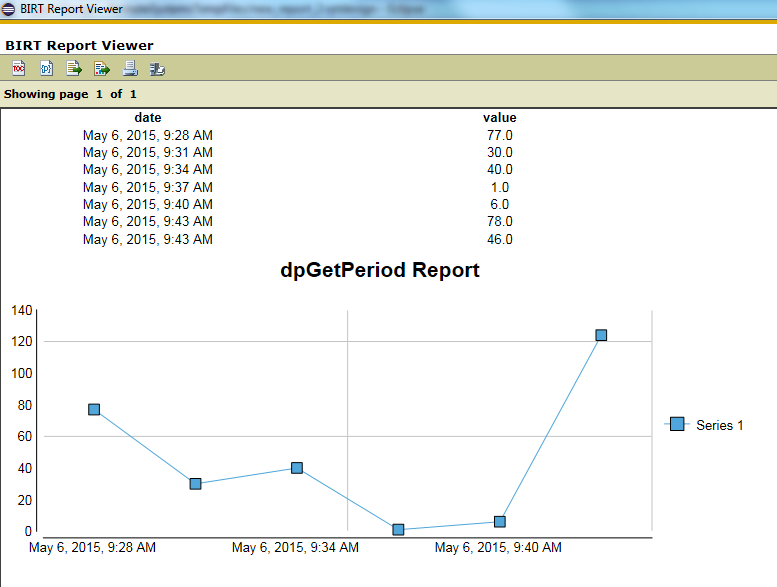
View report
In order to display reports, follow the steps below:
-
Add the appropriate data set from the data explorer to an empty report by using Drag & Drop.
Figure 1. Drag a data set to a report 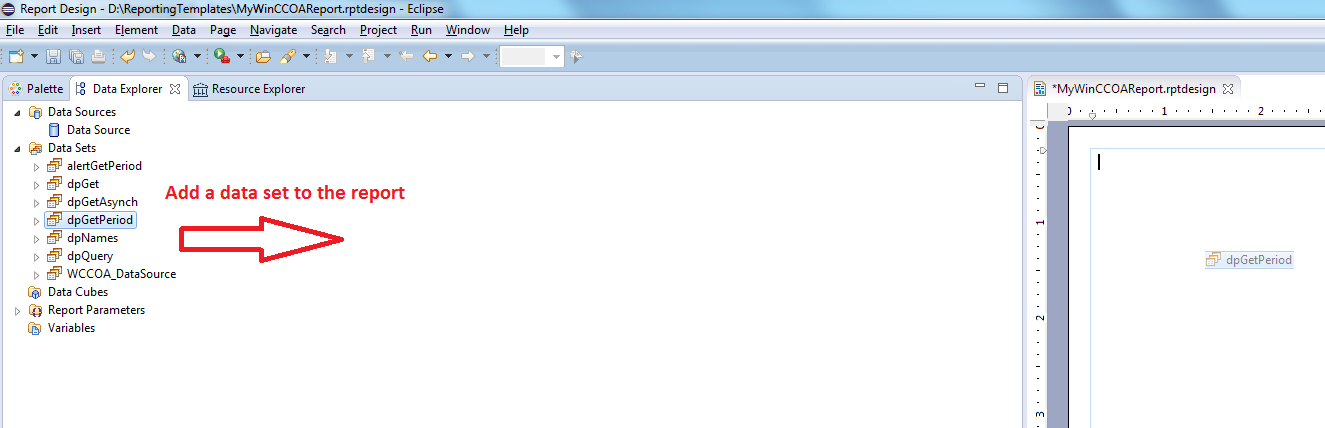
-
The Data Set Binding window is opened. Here you can specify which data set columns are visible in the report.
Figure 2. The Data Set Binding Window 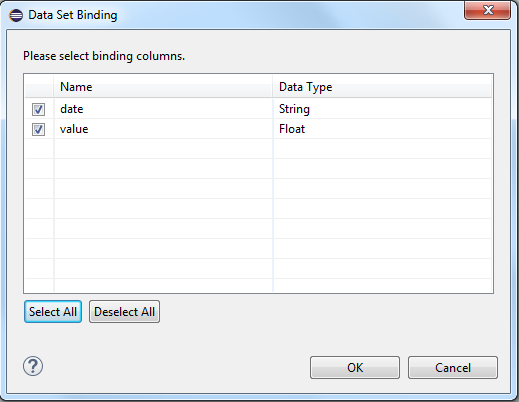
-
After confirming the selected columns with OK, a corresponding table is automatically created.
Figure 3. The Report table 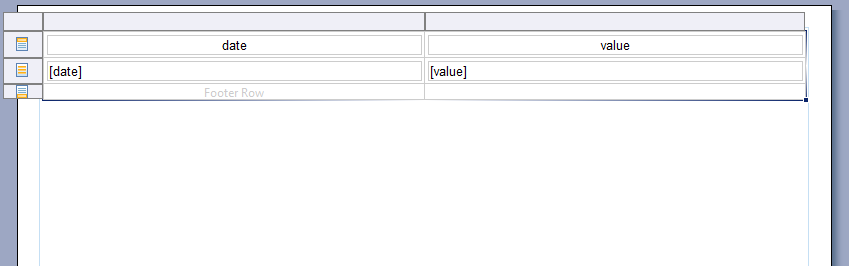
-
Open the "Master Page" of the report and delete the line at the bottom (right-click on the line and select "Delete"). The line should be deleted since the date would be shown at the bottom of the report.
Figure 4. The Master Page of the Report 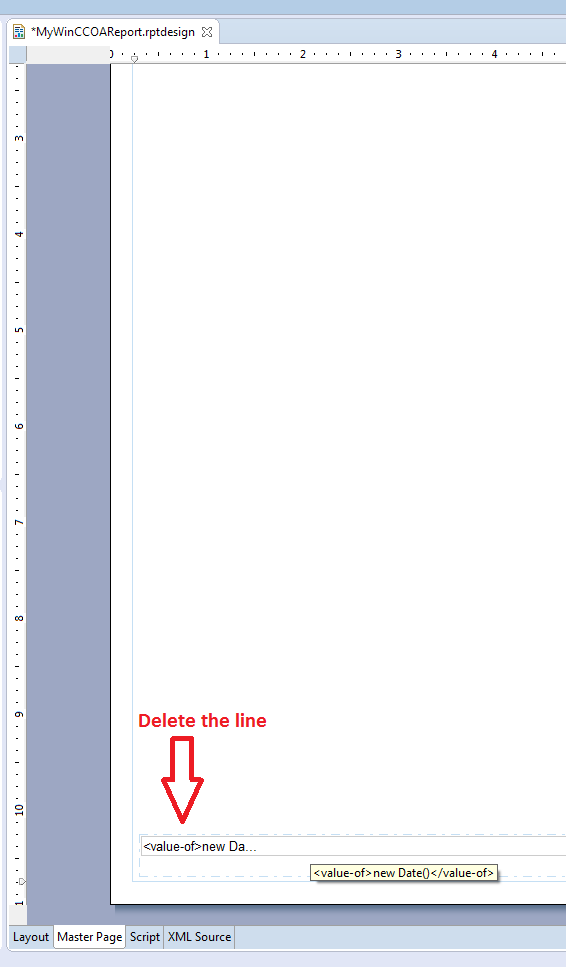
-
Save the report. The BIRT Report Viewer is displayed by clicking on the
 button in the toolbar. If
report parameters were linked with a data set, the following window is opened before the report is displayed:
button in the toolbar. If
report parameters were linked with a data set, the following window is opened before the report is displayed:Figure 5. The BIRT Report Viewer and the Parameter Window 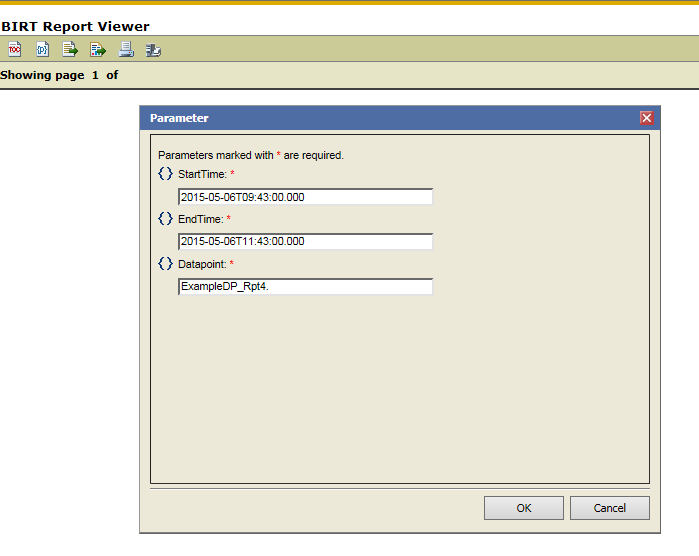
-
Confirm the settings with OK and the report is displayed:
Figure 6. A Report is displayed in the BIRT Report Viewer 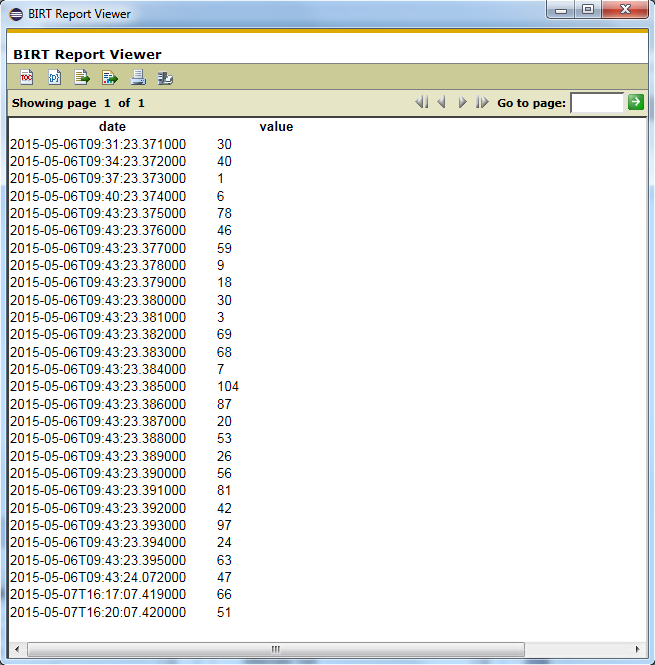
Graphic representation
You can add charts to a report in order to visualize the results.
- Therefore, open the Insert menu and click on Chart.
-
Select the diagram type from "Select Chart Type" and click on Next >
Figure 7. Select Chart Type 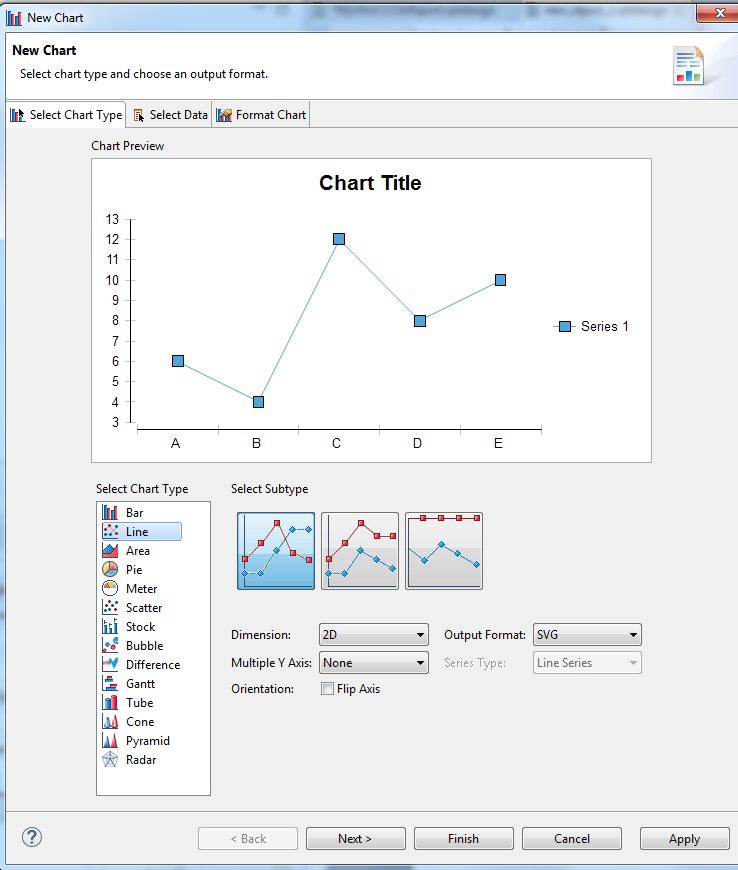
-
Drag the "value" from the "Show data preview" table to the "Value (y) Series" field and drag the "date" from the "Show data preview" table to the Category (X) Series field.
Click on Next >.
Figure 8. Select Data 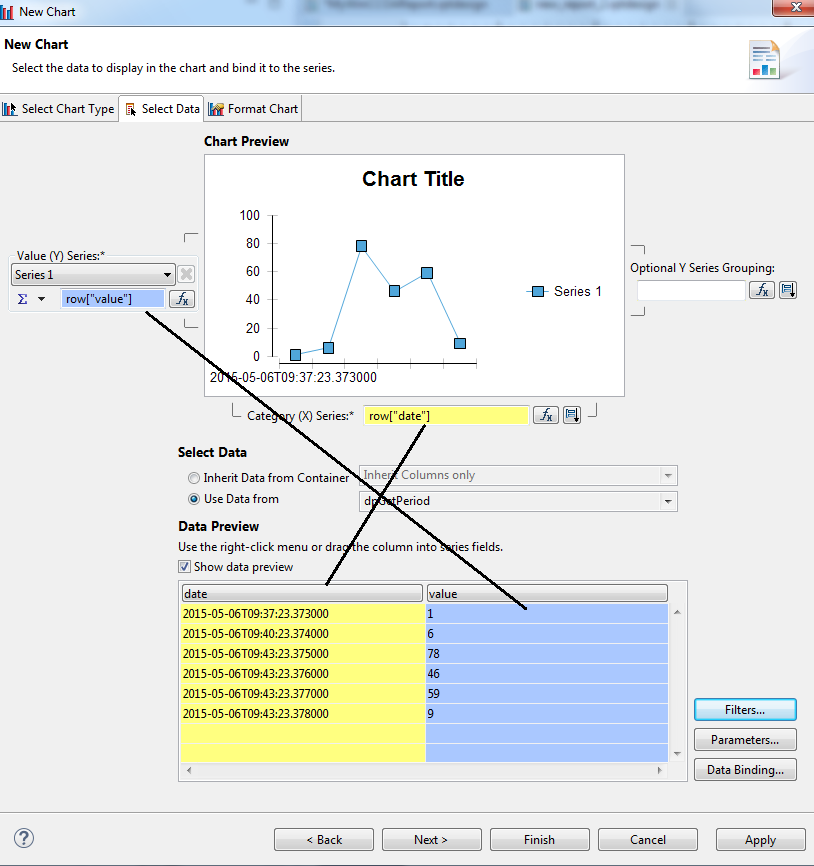
-
Add a chart title:
Figure 9. Add a Chart Title 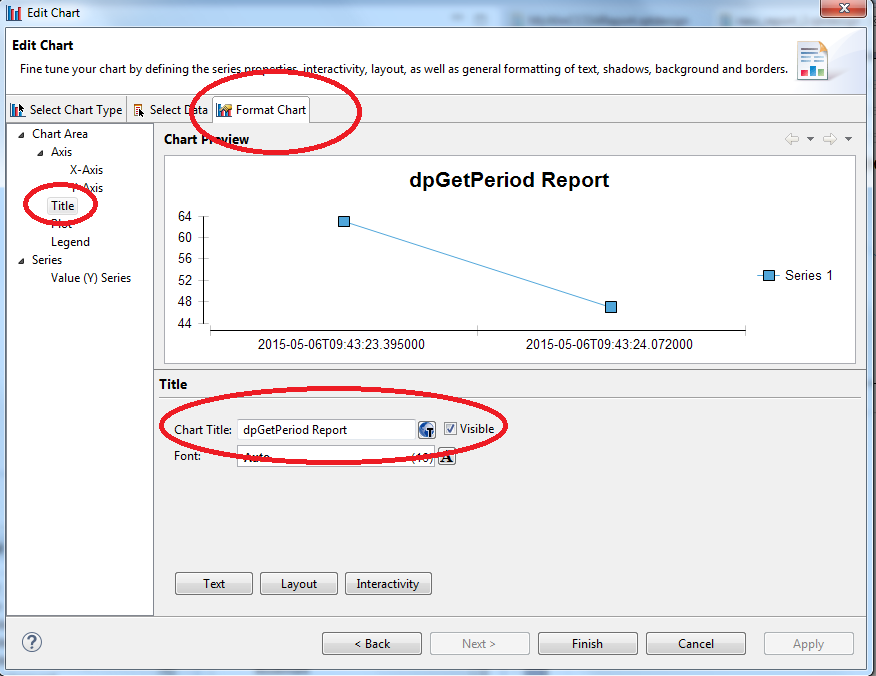
-
Change the settings for the grid lines. Repeat this step for the Y-Axis. Click on Finish:
Figure 10. Settings for the grid lines "X-Axis" 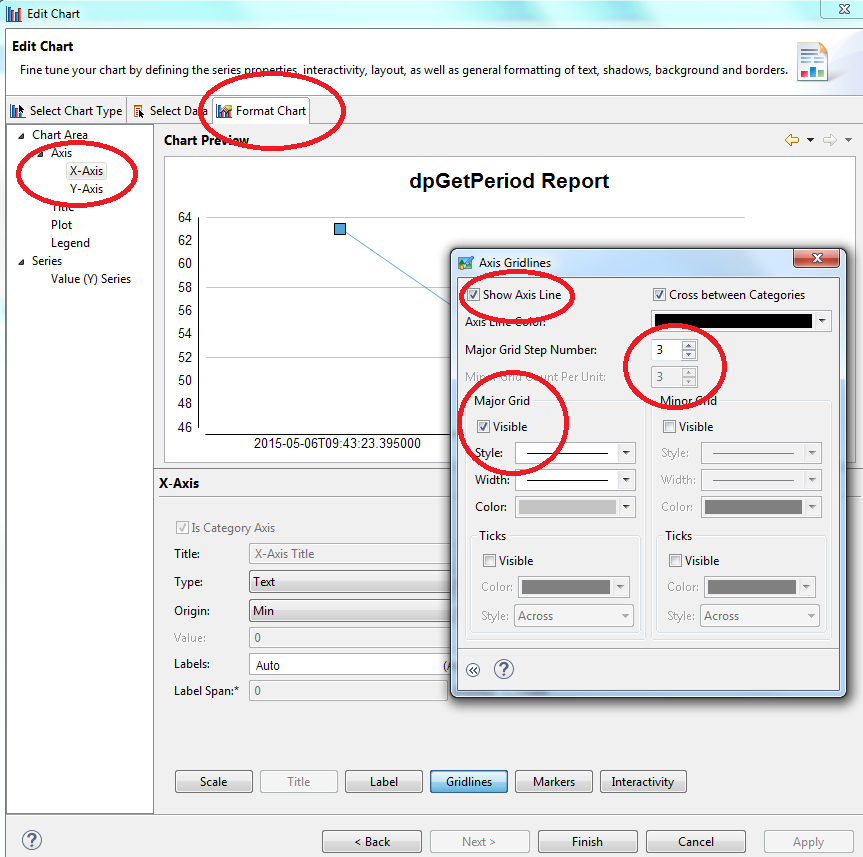
The chart is added to the report:
Figure 11. Graphic representation in a Report 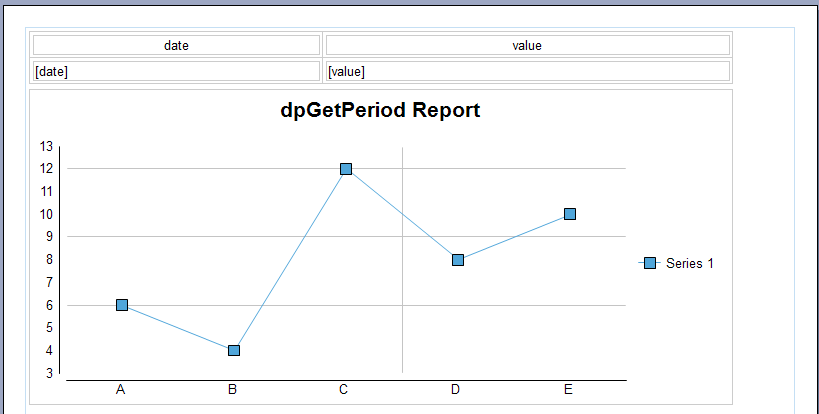
-
Change the Text alignment of the "date" and "value" fields to "Center":
Figure 12. Text Alignment of the "date" field 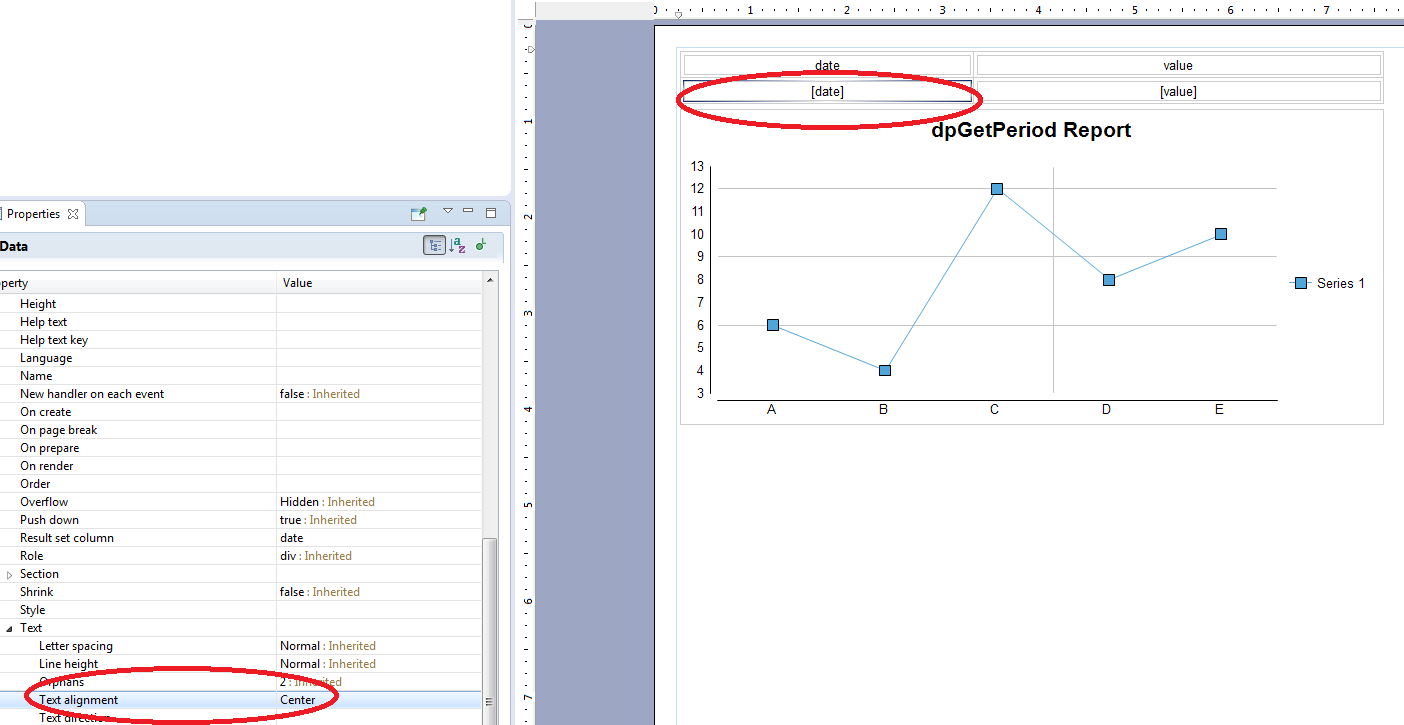
-
Since the string for the date is very long, it should be changed and the decimal places should be shown for the value. Select the "date" field from the report. Open the property editor and select the option "Format DateTime". Change the format to, for example, "Month Day, Year, Time" (e.g. "May 6, 2015, 9:28 AM" . NOTE that you can change the date format only if you changed the data type of the "date" field from a string to "Date" in the "Output columns".
Figure 13. Change the data format of a Report 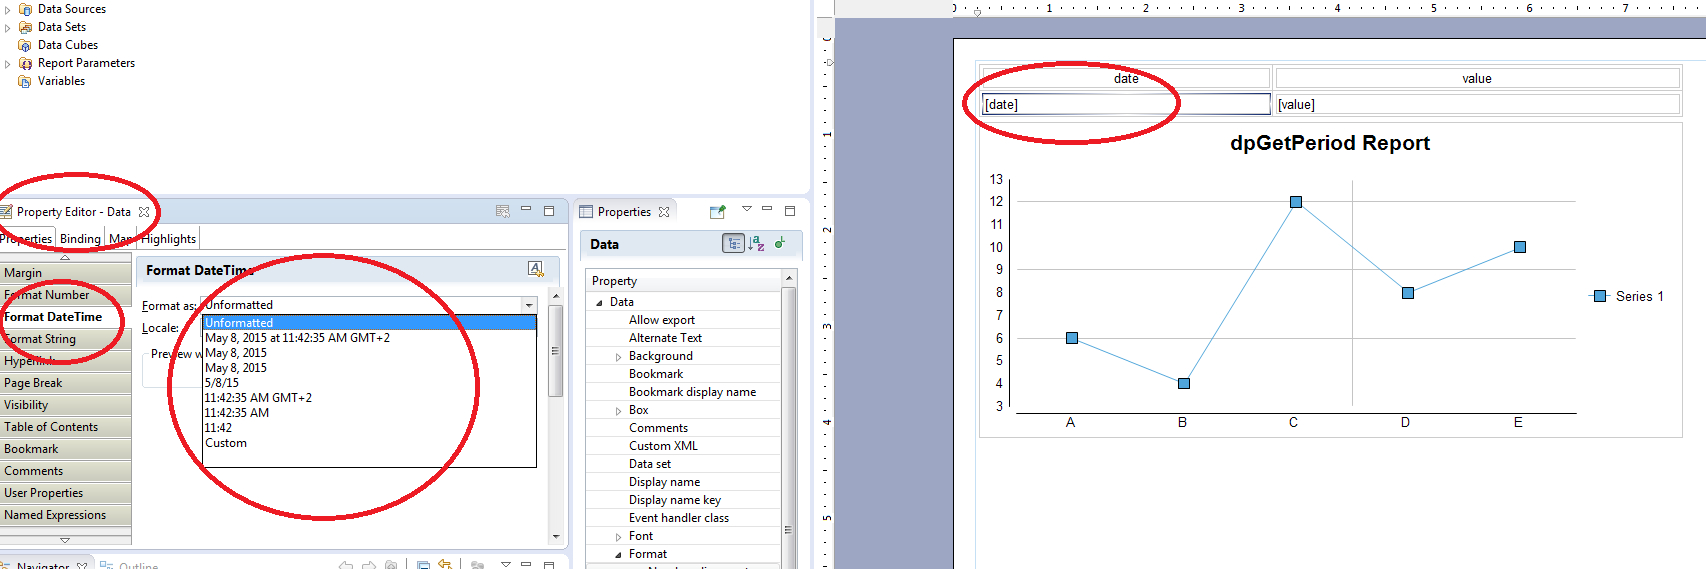
-
Select the "value" field from the report. Open the property editor and select the option "Format Number". Change the format to "Fixed" and the "Decimal places" to 1.
Figure 14. Change the Value format for a Report 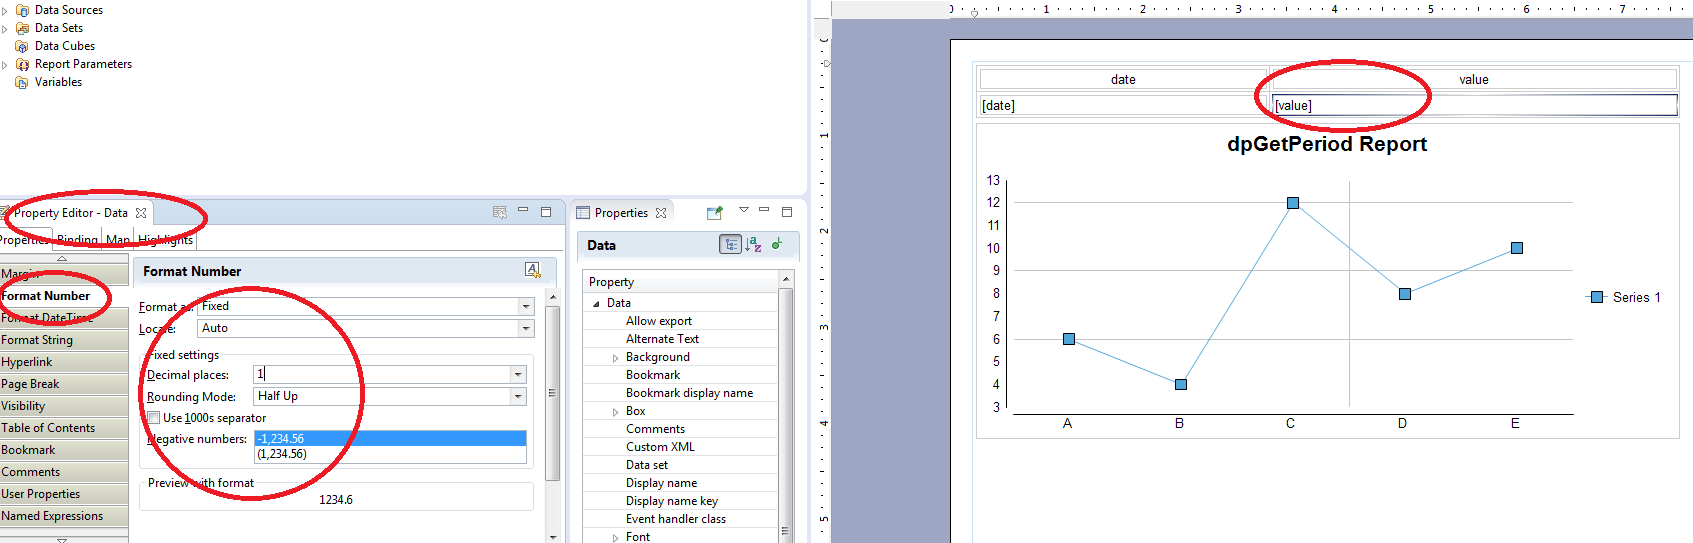
-
Save the report. Click on the
button. The report is opened and the chart is displayed as
follows:Figure 15. A Report in the BIRT Report Viewer