Dashboard
The WinCC OA Dashboard provides a streamlined, mobile-friendly solution for creating customized web-based visualizations of project data. Designed with flexibility and ease of use in mind, it enables users to quickly gain insights into the current state of their systems.
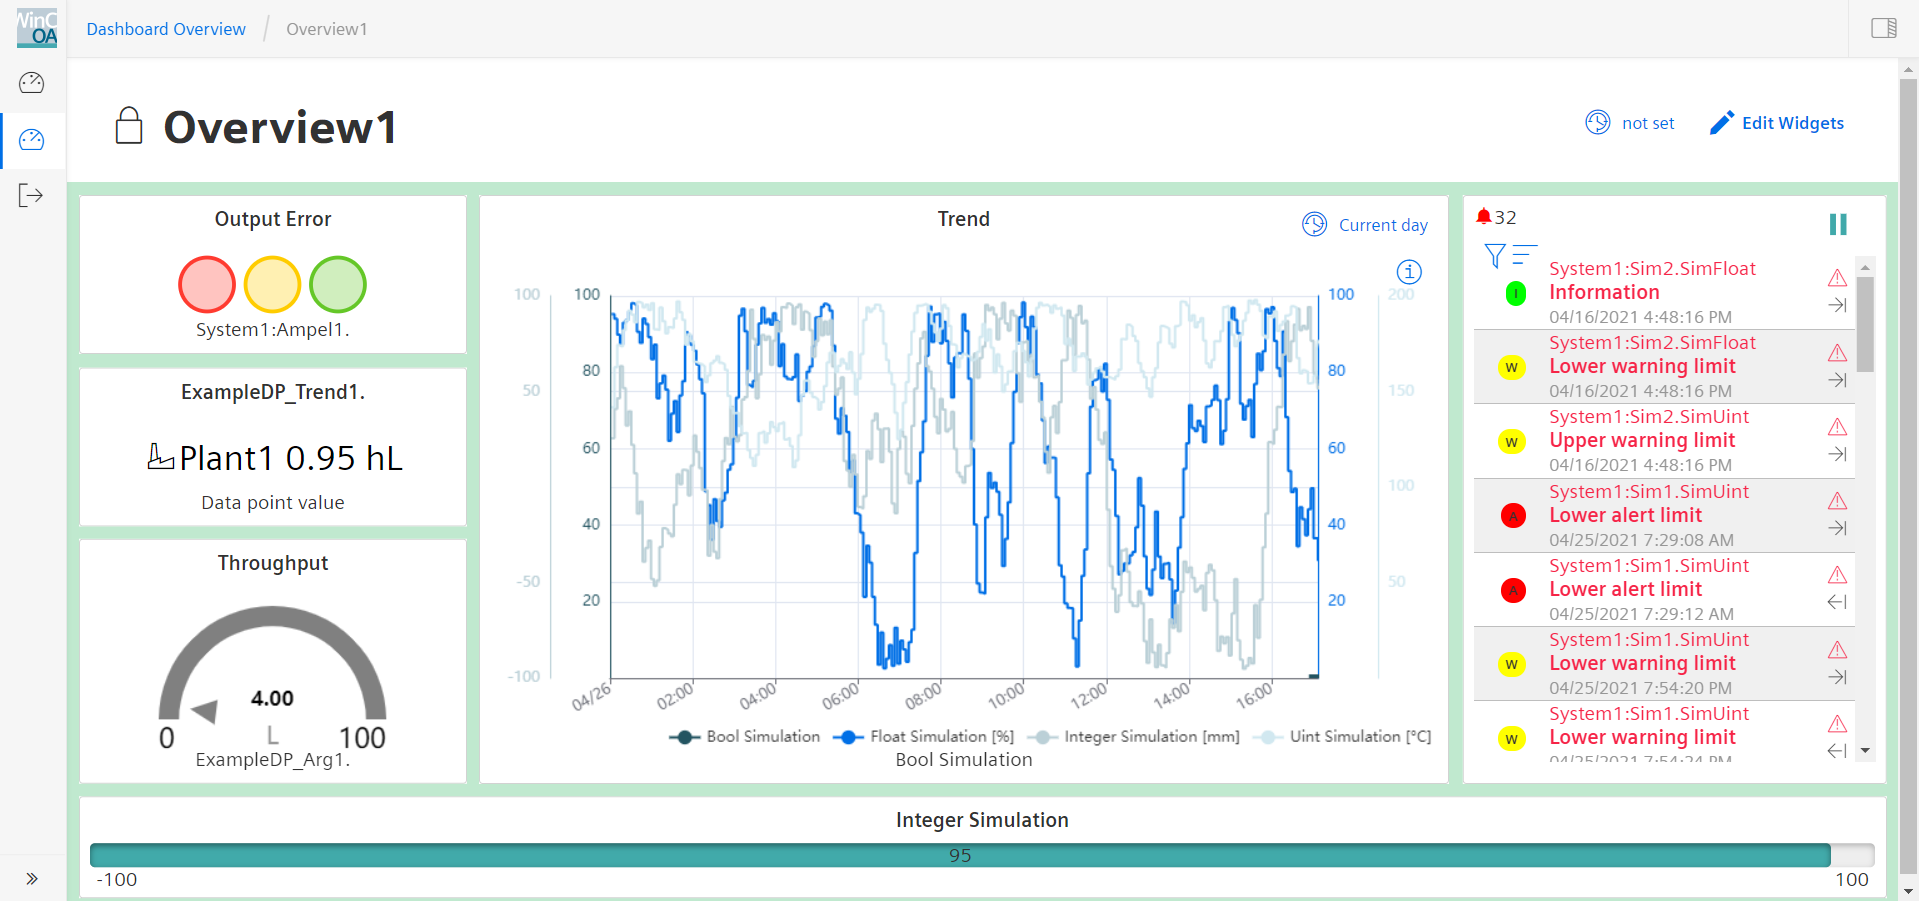
At the core of the Dashboard are configurable widgets that can be linked to project datapoints. These widgets support a variety of visualization formats, including line charts, bar graphs, gauges, and more. By combining multiple widgets, users can build tailored dashboards that reflect the specific needs of their projects.
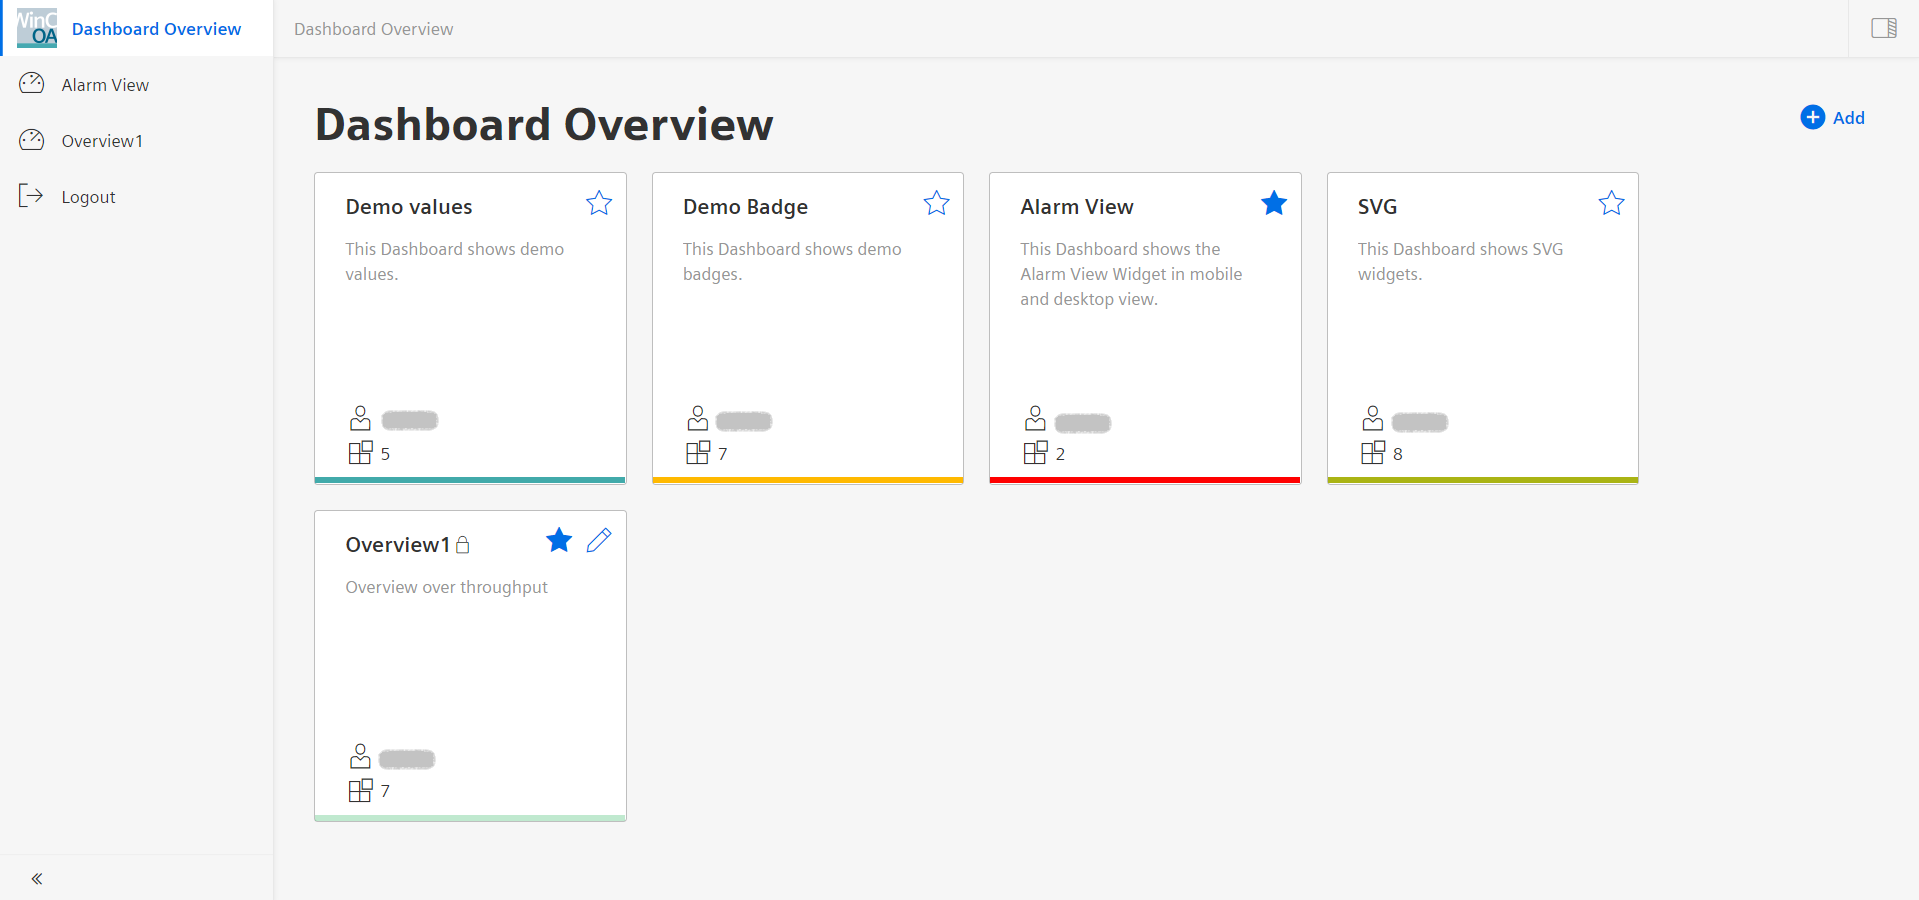
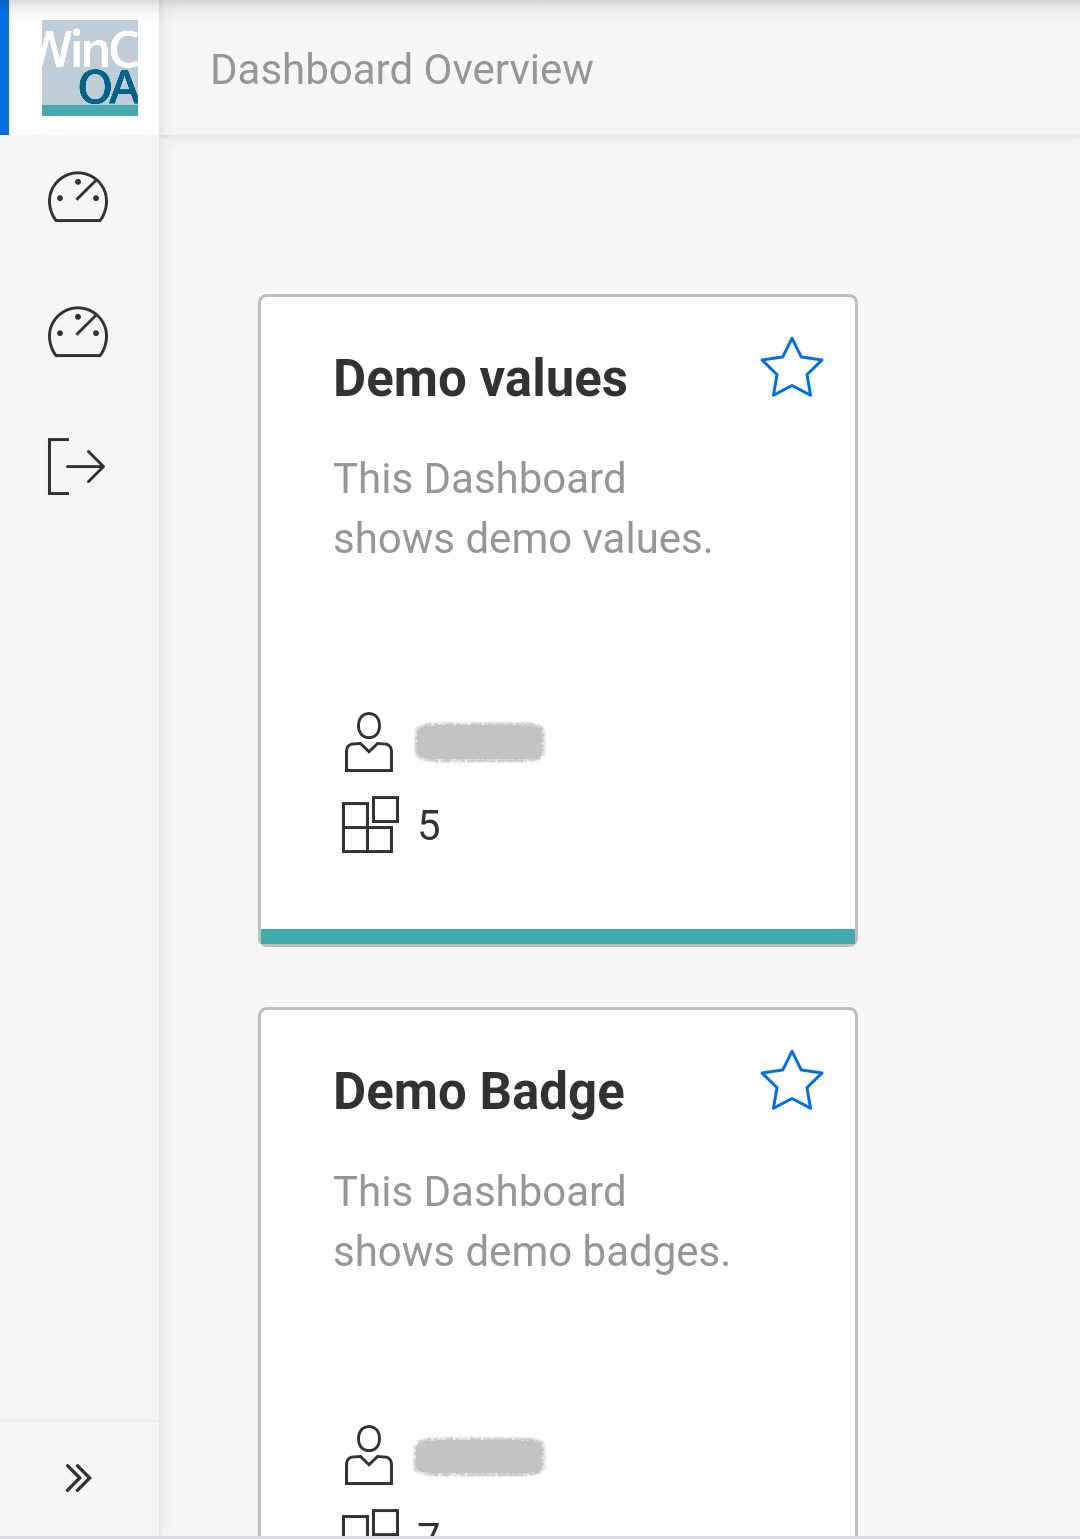
Navigating between dashboards is intuitive thanks to the Dashboard Overview, which offers a centralized view and quick access to all available dashboards.
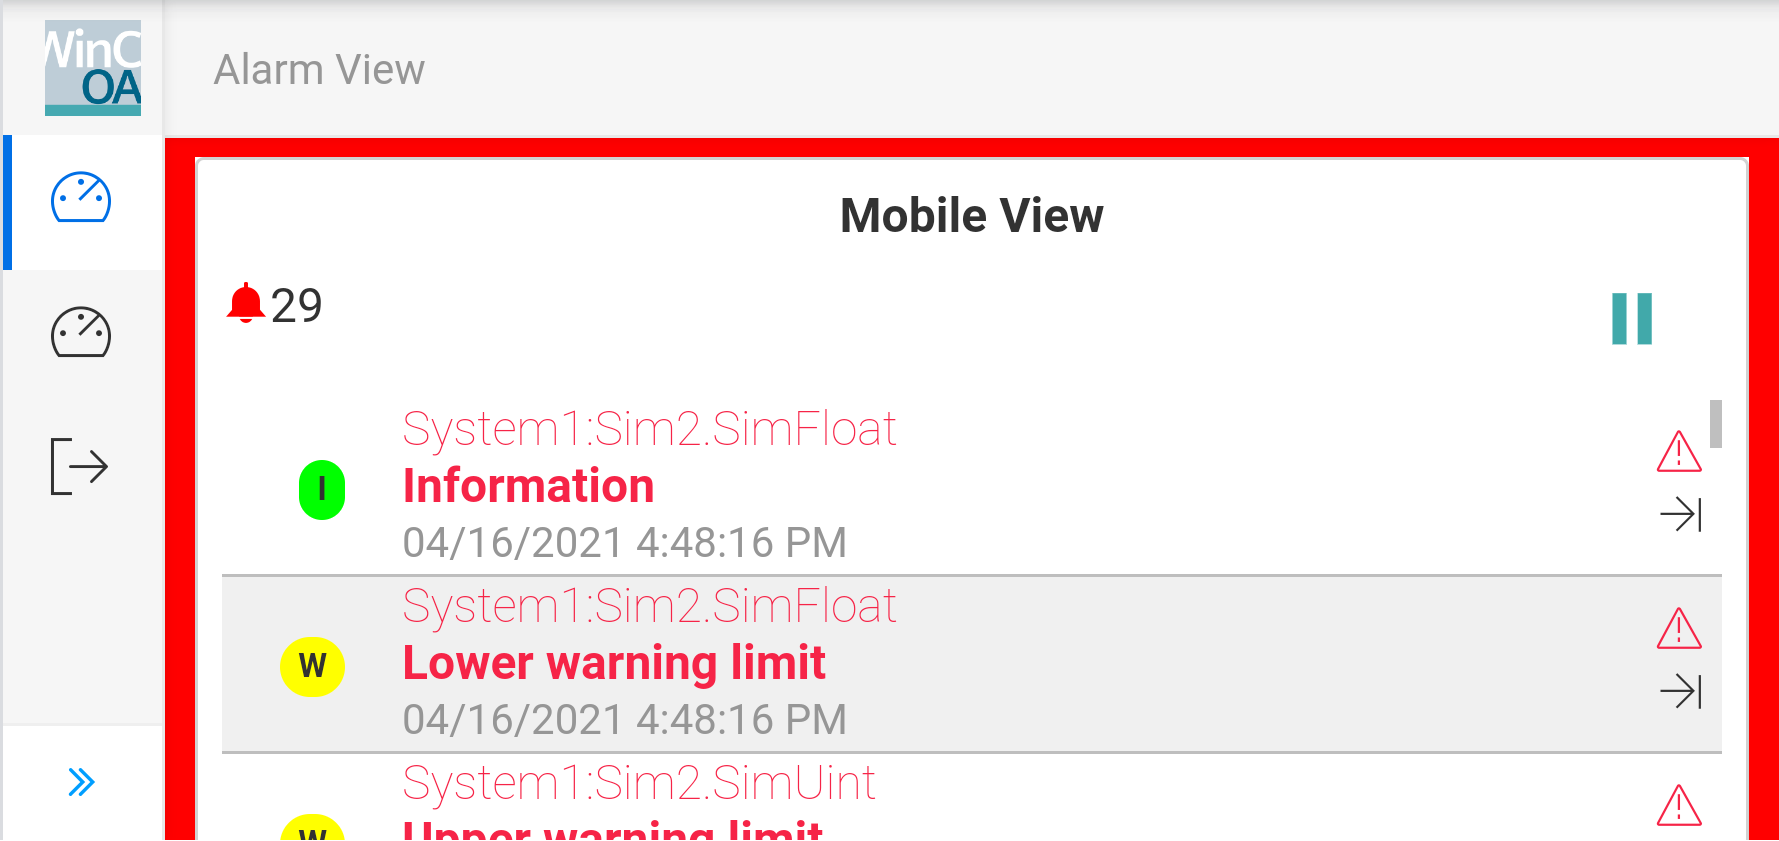
Built on a angular architecture, the Dashboard communicates with the backend via an integrated HTTP server. This ensures seamless compatibility across all major browsers and devices, both on desktop and mobile devices, without the need for additional installations or plugins.