
Diagnosis Overview
The Diagnosis Overview page gives information about the current dashboard related status.
 button below in the sidebar. When logged in, it is also available by replacing
/dashboard/status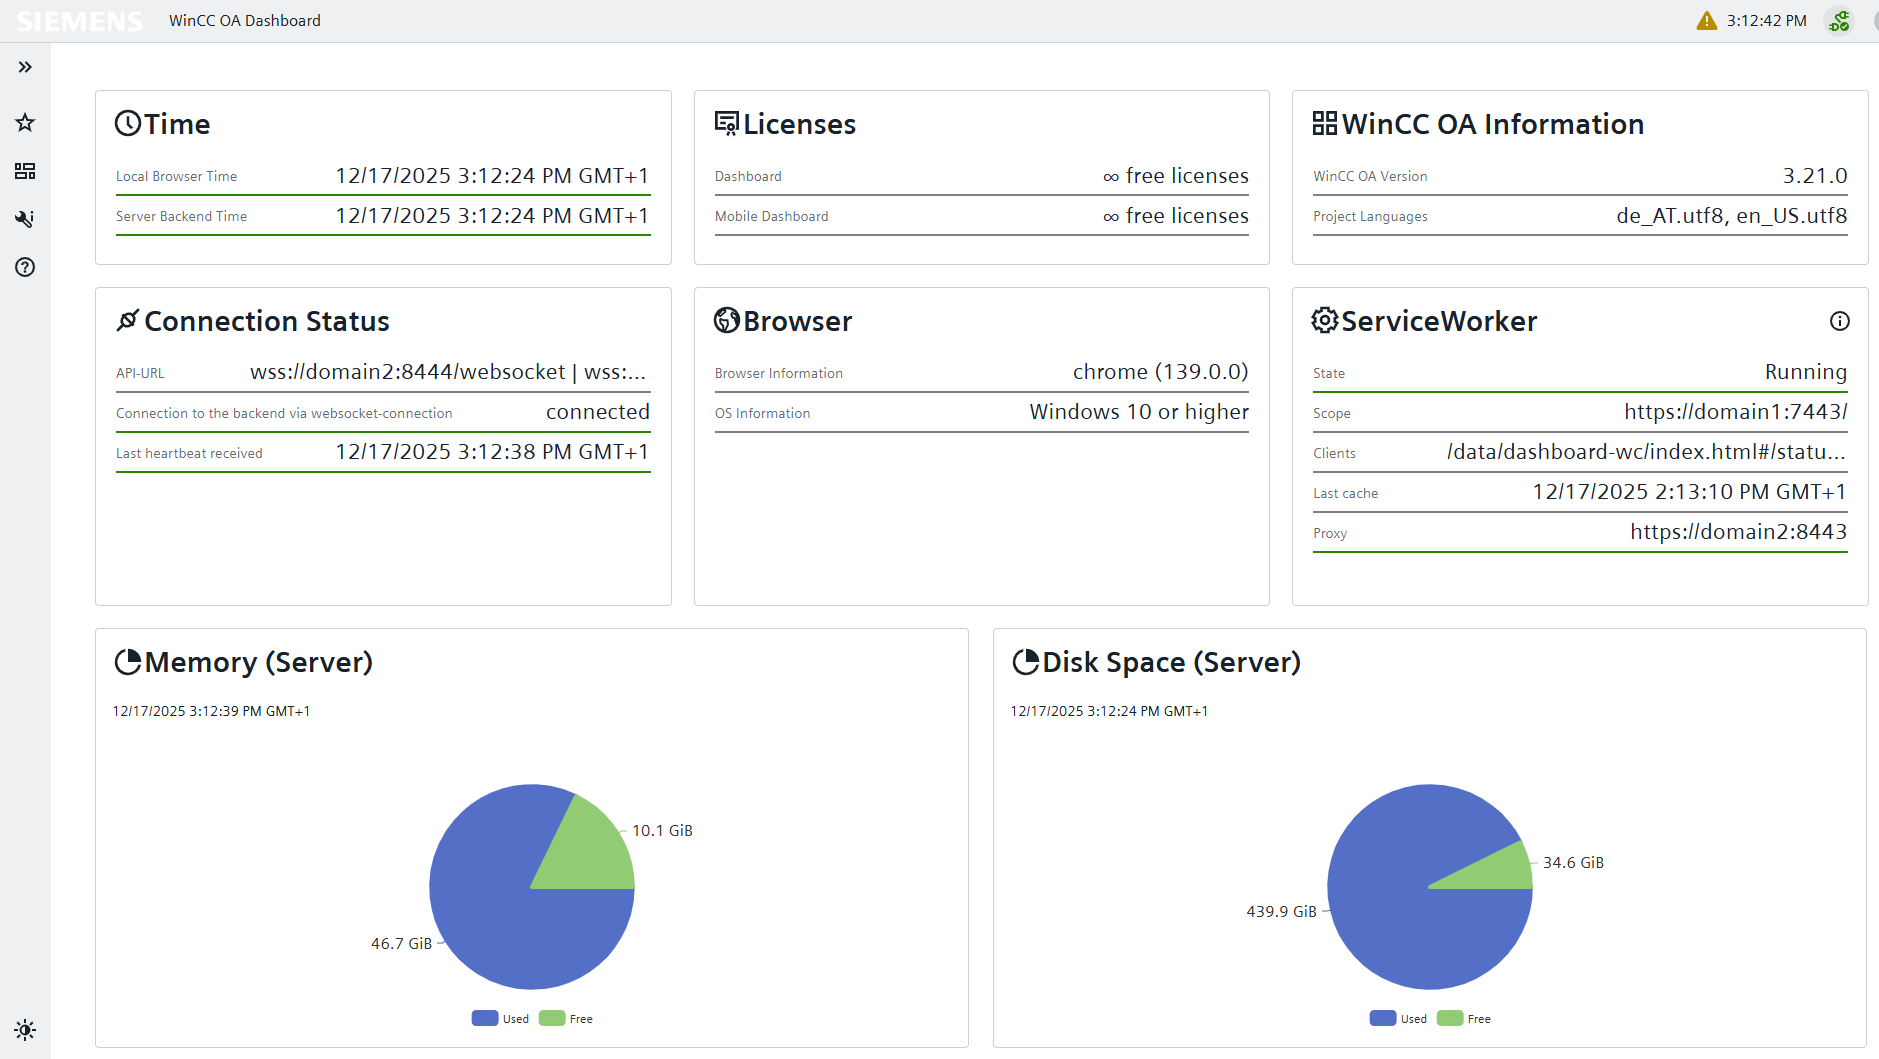
 Time
Time
This area displays the local browser time and server backend time for easy analysis of time-differences.
 Licenses
This area provides information about the remaining available Dashboard licenses and mobile Licenses for both full and mobile Dashboard access. This overview enables an effective management of license usage.
 WinCC OA Information
This area provides information about the current WinCC OA Version used in the product and the available project languages. This information is critical for quickly analyzing compatibility issues.
 Connection
Status
Connection
Status
This zone shows the connection status to the WebSocket server. This contains the API-URL, WebSocket connection status and the last heartbeat time. They provide a quick overview of the current connection state via the last received signal from the server. The connection status and heartbeat are only available when logged in.
 Browser
This area lists the currently used browser version and OS information for the machine the Dashboard is running on. This information is essential for keeping track of updates and other potential compatibility issues.
 Service
Worker
Service
Worker
If a Service Worker is used for High Availability, this section of the diagnostics page appears. Here, the current state of the connection via the Service Worker, the scope of the initial HTTP server connection, and the clients currently connected to the Service Worker are displayed. The last cache time indicates when this information was last retrieved. In the case of a redirect through the configured load balancing, the proxy field shows the address of the current connection.
 Memory
This section displays the current memory usage on the Server. High memory usage may indicate a performance loss for the Dashboard. This information is only available when logged in.
Disk Space
This section displays the currently used disk space on the server. A low disk space may mean no more Dashboards can be created. This information is only available when logged in.