REST Reporting API - Power BI Example "/reporting/Dps"
Requirements
- Read the chapter Requirements and Installation.
-
Install a reporting tool that supports JSON via URL, e.g. Power BI, BIRT or Excel.
-
Start your project and generate some test-data using the example panel:
Panel\Examples\ReportingSampleData.pnl
-
Check if the REST Reporting API returns data as desired by entering URL into the Web Browser of your choice (e.g.):
https://localhost:2444/reporting/Dps?from=2023-02-13T12:00:00.000Z&to=2023-02-13T15:00:00.000Z&&System1:ExampleDP_Rpt1.&System1:ExampleDP_Rpt2
Figure 1. REST Reporting API - URL in Browser 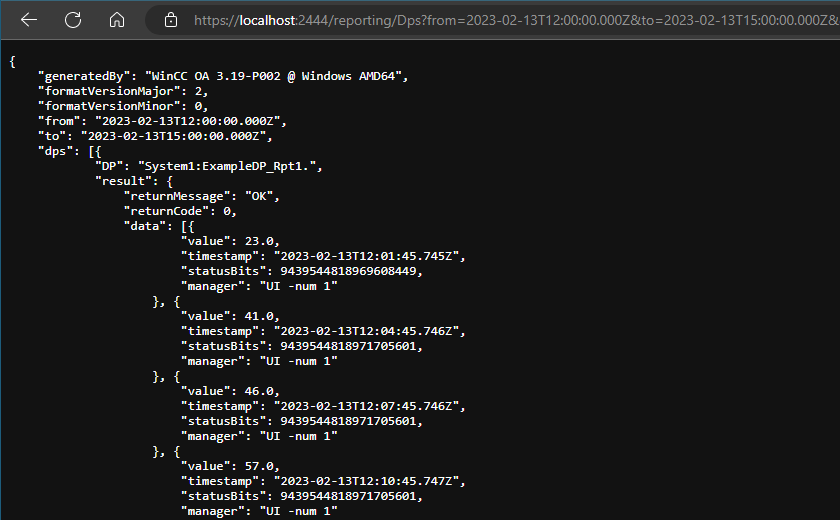
- Open the Power BI. Consider the Requirements and Installation e.g. regarding certificates.
Note:Note also that historical data must be available.
-
In order to use Reporting, add the URL https://localhost:2444/reporting/Dps?from=2023-02-13T12:00:00.000Z&to=2023-02-13T15:00:00.000Z&&System1:ExampleDP_Rpt1.&System1:ExampleDP_Rpt2 via .
Figure 2. Rest Reporting API - get Data 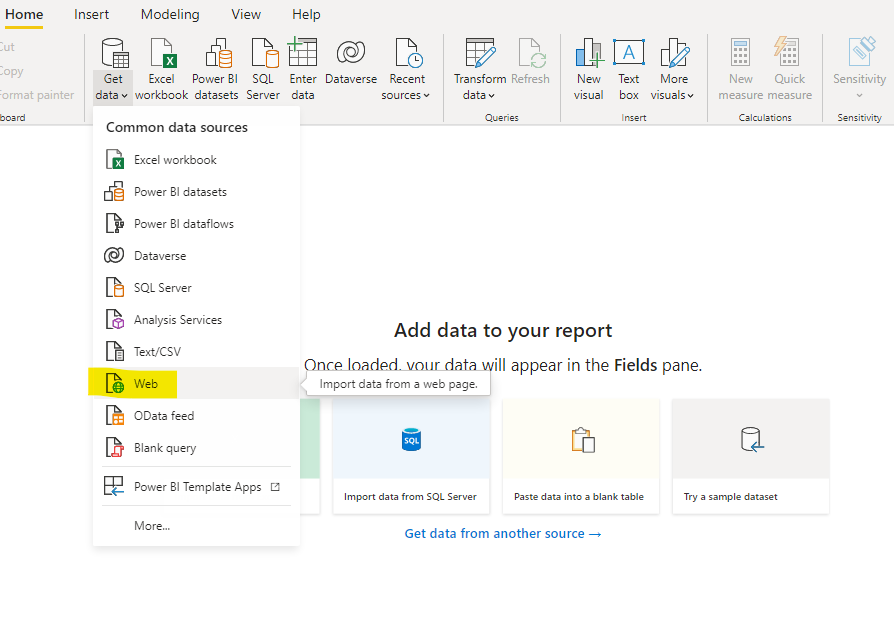
- Configure the URL and click OK.
Figure 3. Enter URL 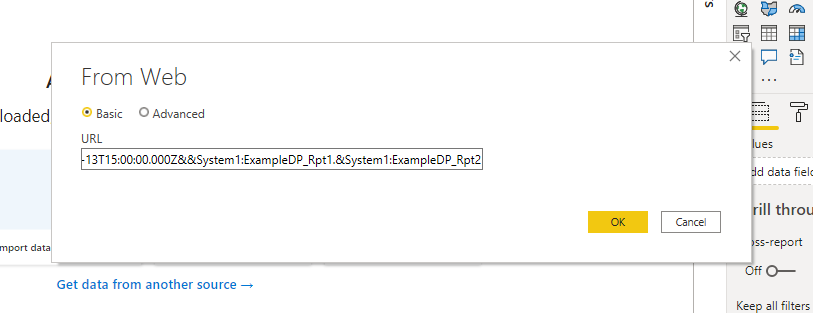
- The Query Editor is opened. Enter a proper name for the query. The query is for the datapoints Rpt1 and Rpt2:
Figure 4. Query in the Query Editor 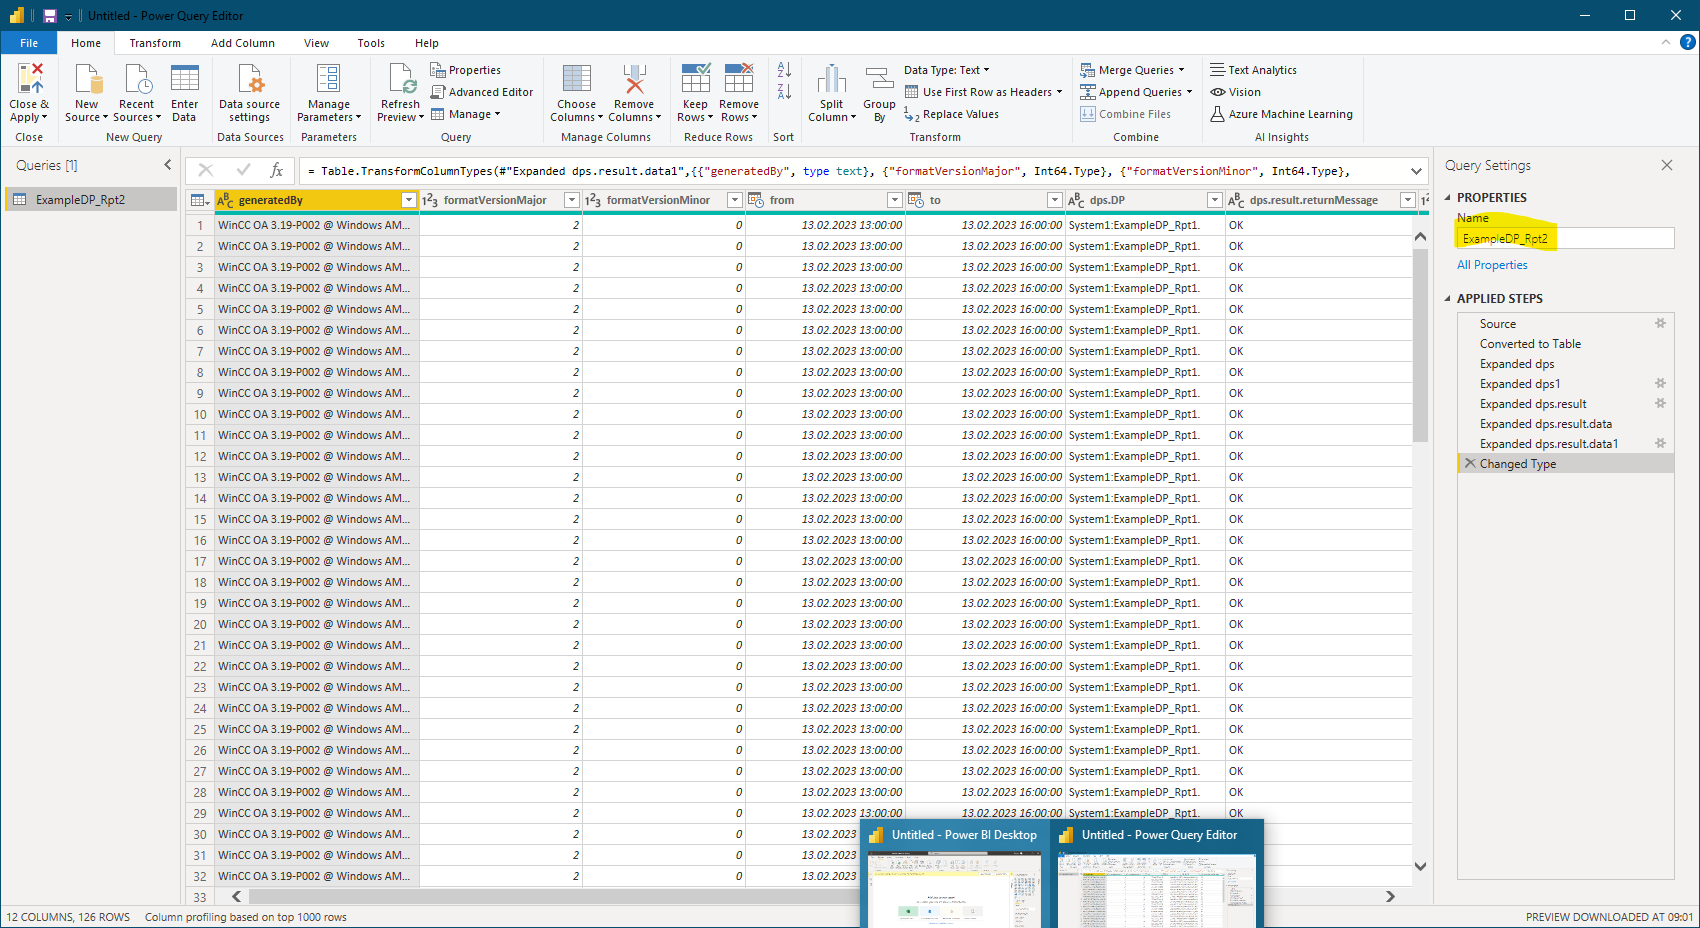
- Change the type of the dps.results.data.value to Decimal:
Figure 5. Change Type 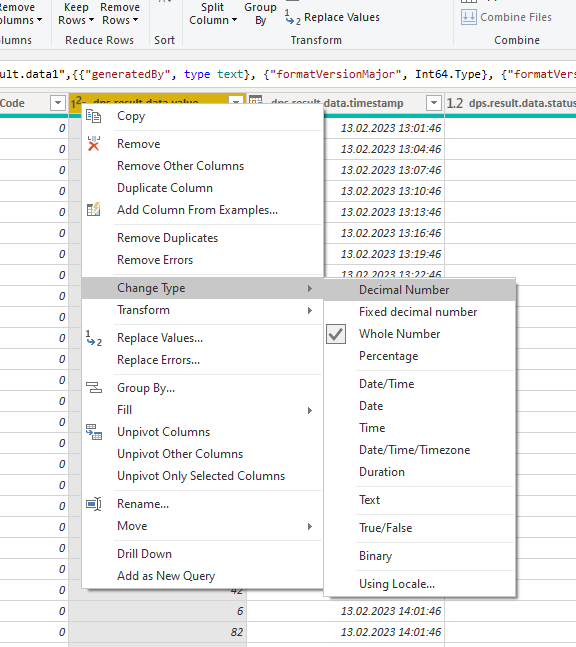
- Close the window and apply the changes:
Figure 6. Close the Window and apply Changes 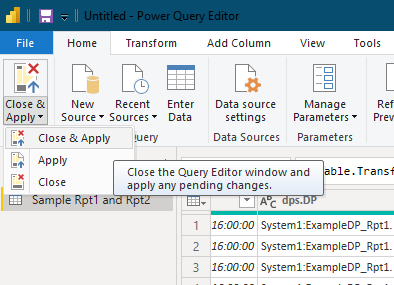
- Save the file Example.pbix
Figure 7. Save the Example 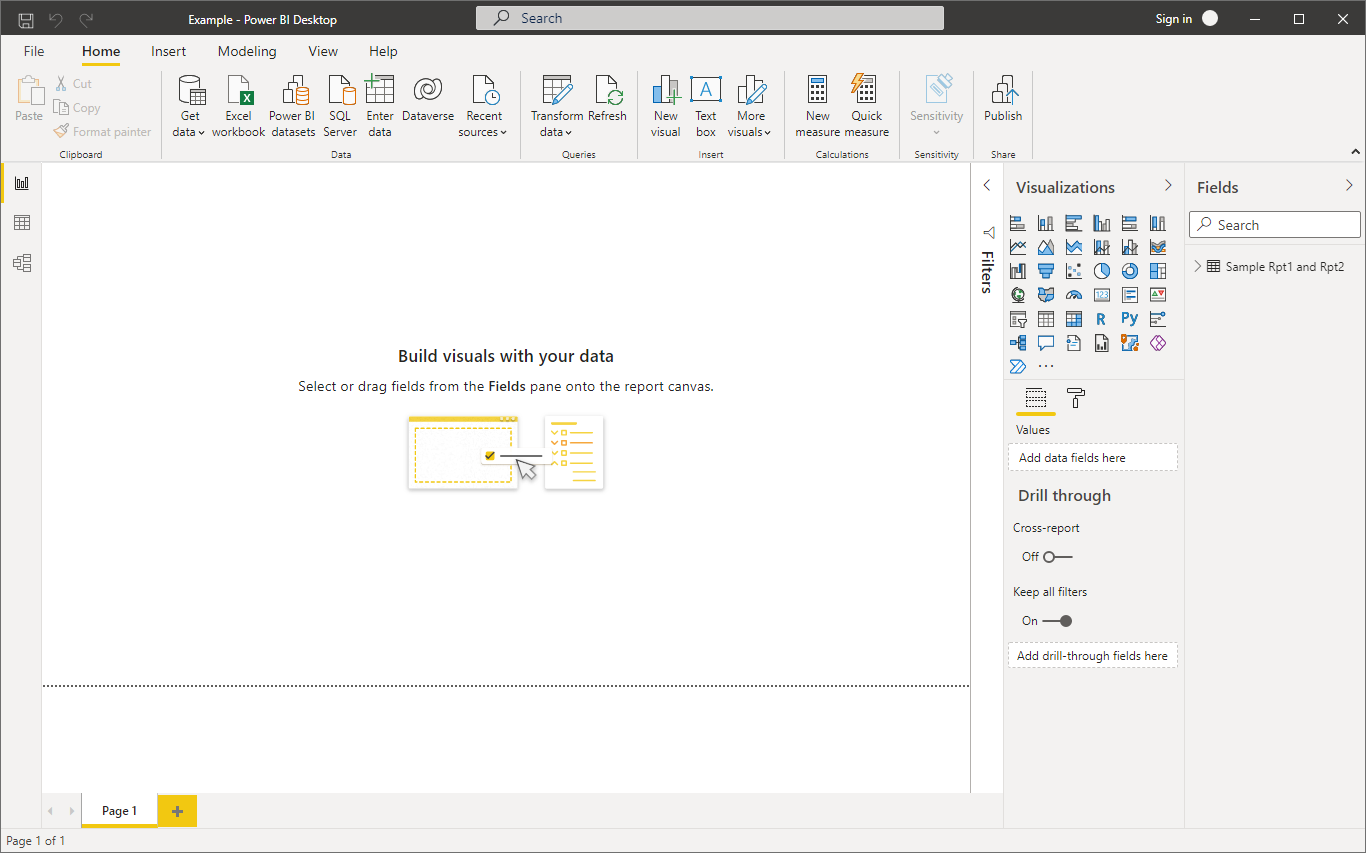
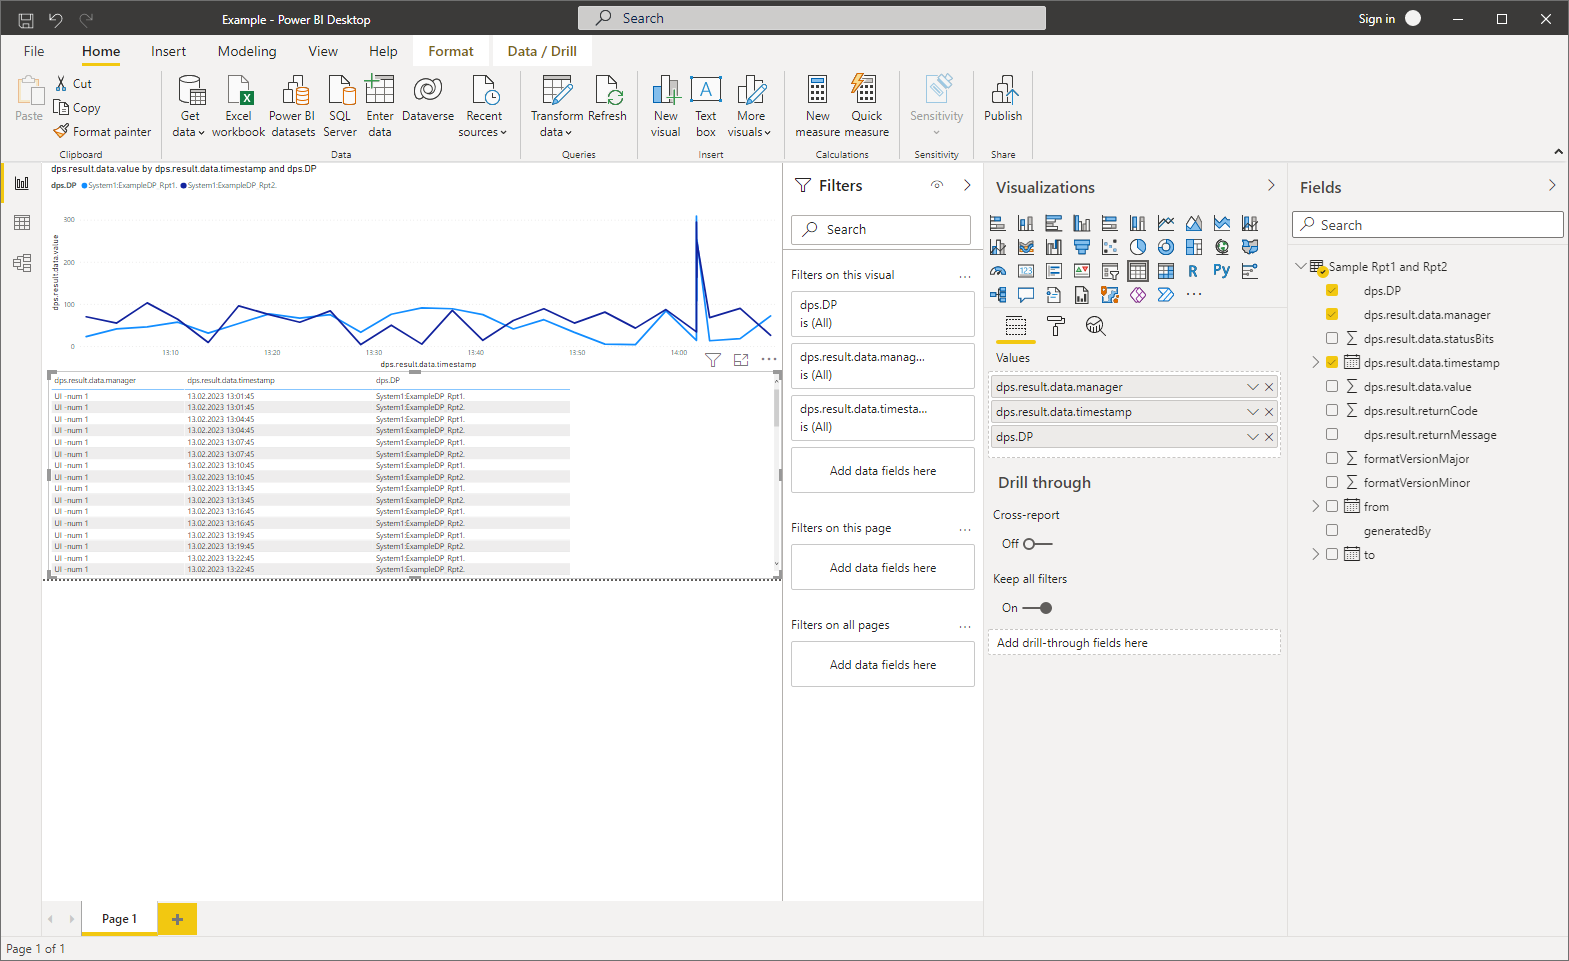
- The Main window is opened. In the Visualizations area add a line chart:
Figure 8. Add a Line Chart 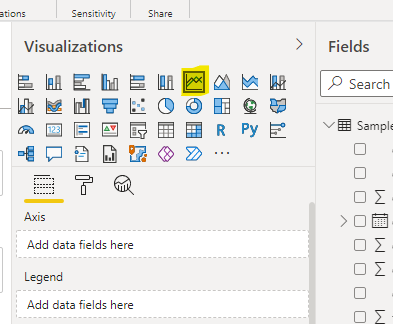
- Drag the dps.result.data.timestamp to the Axis field and change from date hierarchy to dps.result.data.timestamp:
by applying the change.
Figure 9. Add a Line Chart 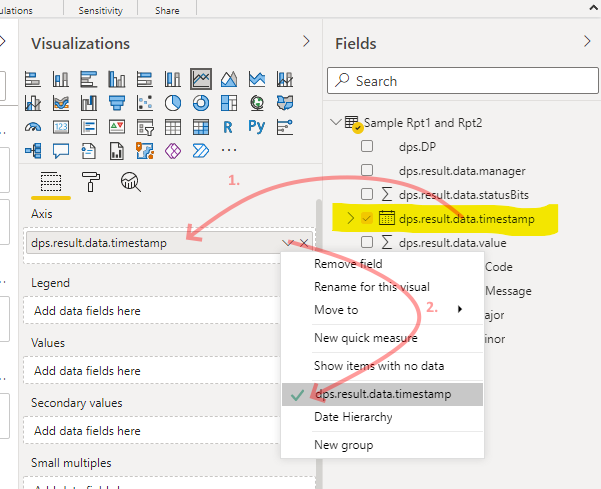
- Drag dps.DP to the Legend and dps.result.data.value to Values.
- The result should look as follows:
Figure 10. Result 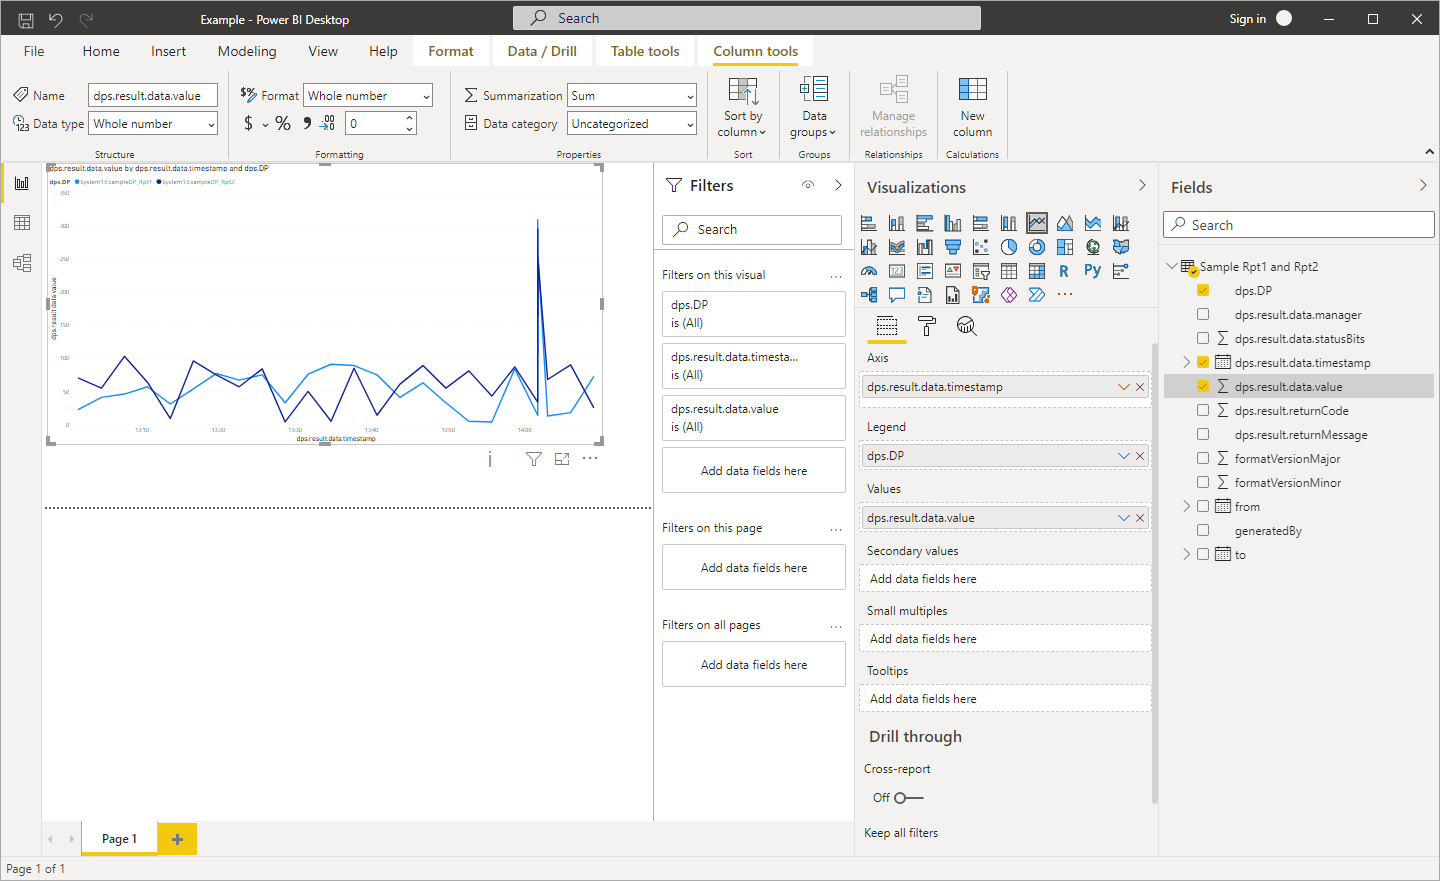
- Add a table:
Figure 11. Add a Table 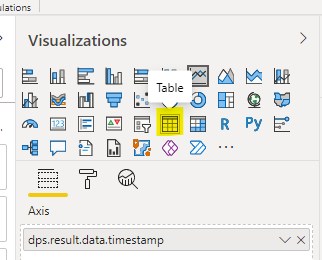
- Drag dps.result.data.manager to Values.
Figure 12. dps.result.data.manager to Values 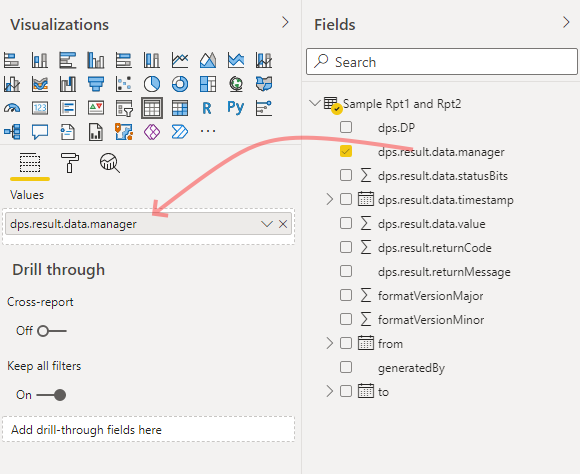
- Drag dps.result.data.timestamp to Values.
Figure 13. dps.result.data.timestamp to Values. 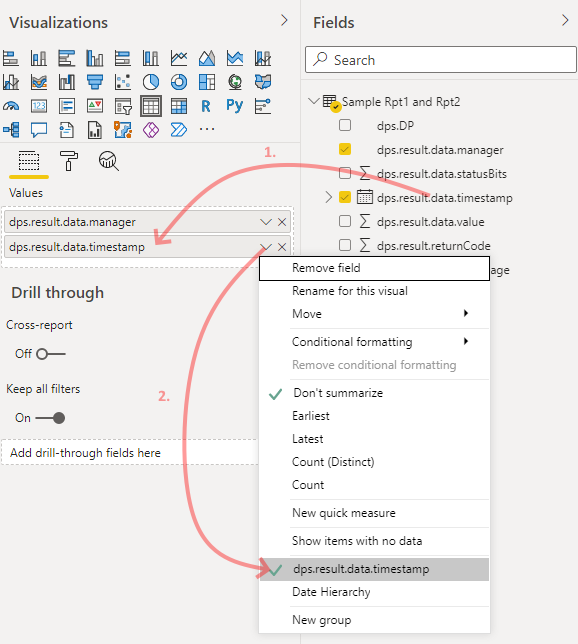
- Drag dps.DP to Values.
Figure 14. dps.DP to Values 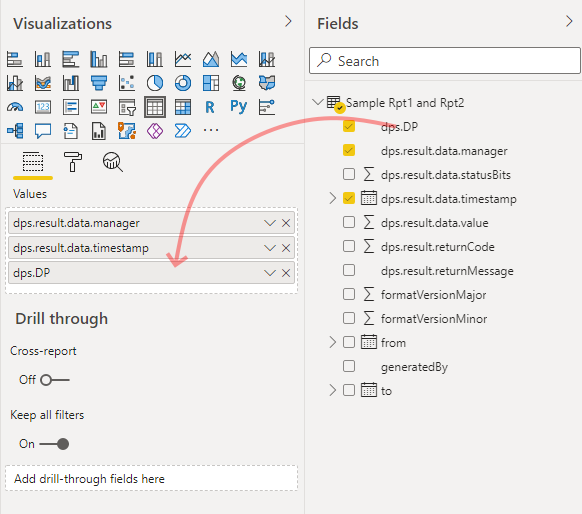
- The result should look as follows:
Figure 15. Result