
CTRL Debugger Panel
A manager can execute several CTRL scripts simultaneously. A script can contain several threads. You can analyze a script or a thread in the script. Multiple debugger windows can be opened. If a script that has been opened in the debugger is closed, a message is displayed in the debugger. The debugger stops on the line in the code where a code is executed, but not on empty declarations.
Open the CTRL debugger panel via .

Or via the same symbol  in the
WinCC OA console. Control (CTRL) and UI managers can be
debugged.
in the
WinCC OA console. Control (CTRL) and UI managers can be
debugged.
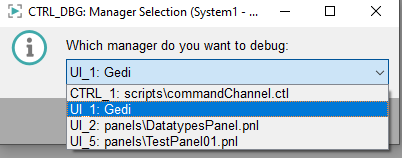
With the CTRL Debugger you can debug scripts or threads. The scripts can, however, not be changed in the debugger. You can, however, open a script in the script editor via the CTRL debugger or a panel in the GEDI. See further below.
ScopeLibs cannot be debugged!
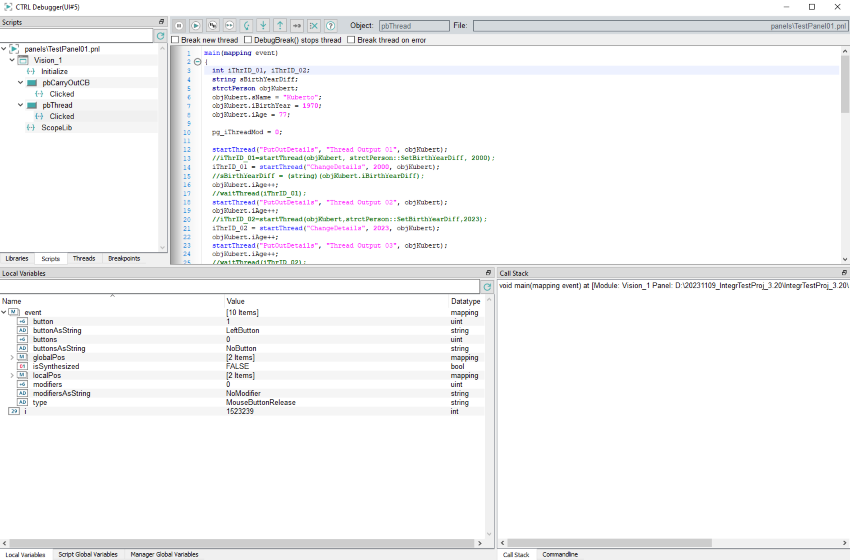
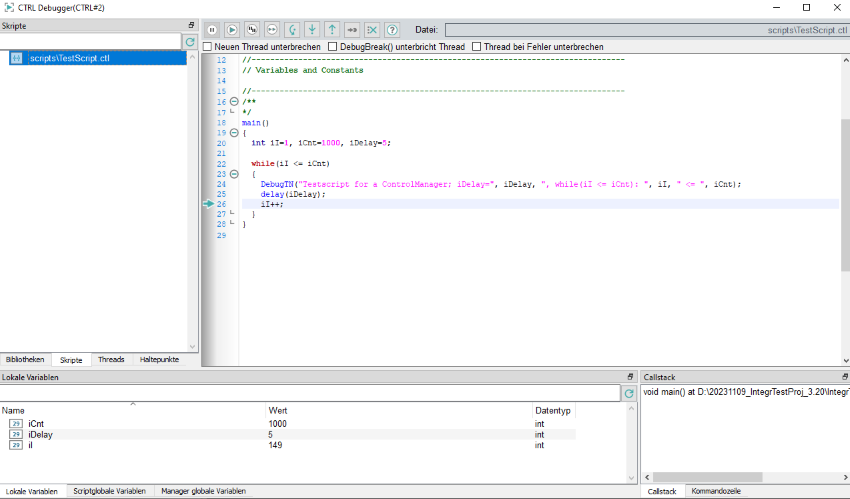
The panel contains 5 main areas that are described in detail in the following:
- The script window (in the middle)
- The Window for CTRL libraries, scripts and breakpoints (left-hand side)
- Window for variables - local variables, script local variables, global variables (at the bottom)
- Help window for commands under "Command line" and call stack (at the bottom right)
- Info window (top right)
as well as the
Since the windows are DOC modules, these can be moved and placed freely.
If the user interface or the CTRL manager that should be debugged does not run, an error message is shown in the main window:

After the restart of a manager, all views of the debugger are updated.