Use of the Data in MindApps
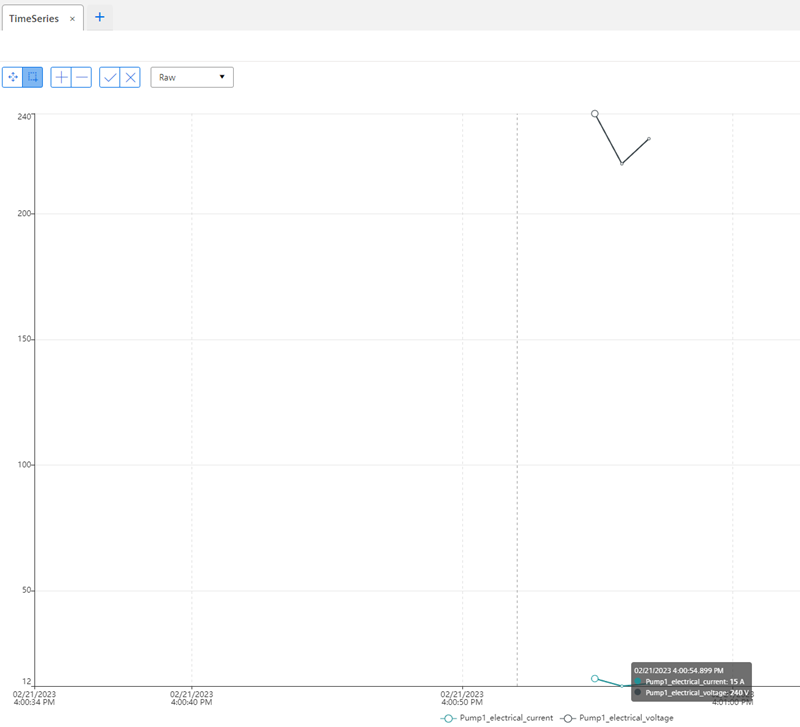
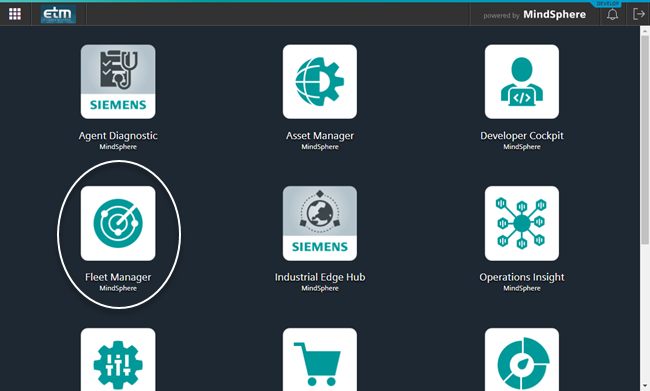
Now you can process the uploaded data in MindApps. A simple example is the presentation of the data in a trend in the Fleet Manager app. Select the asset Pump1_electrical_current created in the step 8 from the Fleet Manager. Open the Fleet Manager via the Insights Hub home page.
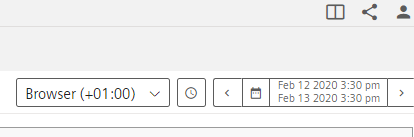
In order to visualize the values, select the right time range (current time - 2 seconds).