 "data" -
Curve
"data" -
Curve
Data for the bar trend in the curve display mode.
Synopsis
setValue(string shape, "data", dyn_float DataX, dyn_float
                DataY);
getValue(string shape, "data", dyn_float &DataX, dyn_float
                    &DataY);
shape.data(dyn_float DataX, dyn_float DataY);
Parameters
| Parameter | Description |
|---|---|
| shape | Name of the object |
| DataX | X values |
| DataY | Y values |
Description
This attribute specifies the data for the curve, whereby the coordinates of the individual points are specified in the dyn_float arrays DataX (x-coordinates) and DataY (y-coordinates).
Example
main()
{
  shape bt=getShape("BAR_TREND1");
  bt.Type=5;
  dyn_float dx, dy;
  // Points for the curve
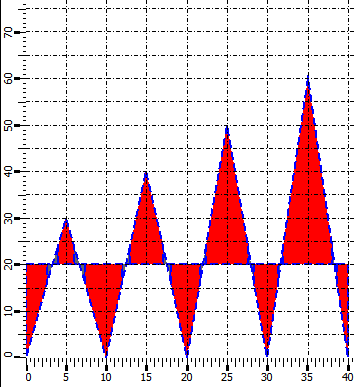
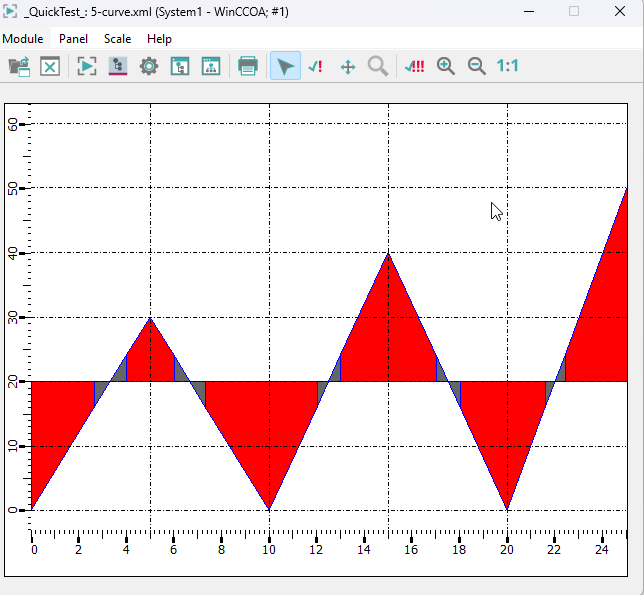
  dx=makeDynFloat(0,5,10,15,20,25,30,35,40);
  dy=makeDynFloat(0,30,0,40,0,50,0,60,0);
  // Setting the values
  setValue(bt, "data", dx, dy);
  // Linear curve
  bt.connection=BAR_LINEAR;
  // Fill the area
  bt.fill=TRUE;
  //Line color
  bt.lineColor("blue");

  bt.xRange(25);
  bt.xStep(5);
  bt.yCenter(30);
  bt.yRange(220);
  bt.yStep(10);
}
You can set the line type via the attribute "lineType"
bt.lineType("[dashed,oneColor,JoinMiter,CapButt,2]");