Open a web browser either Google Chrome or Mozilla Firefox.
Enter the URL http://127.0.0.1:3000 (by default Grafana® listens to port 3000).
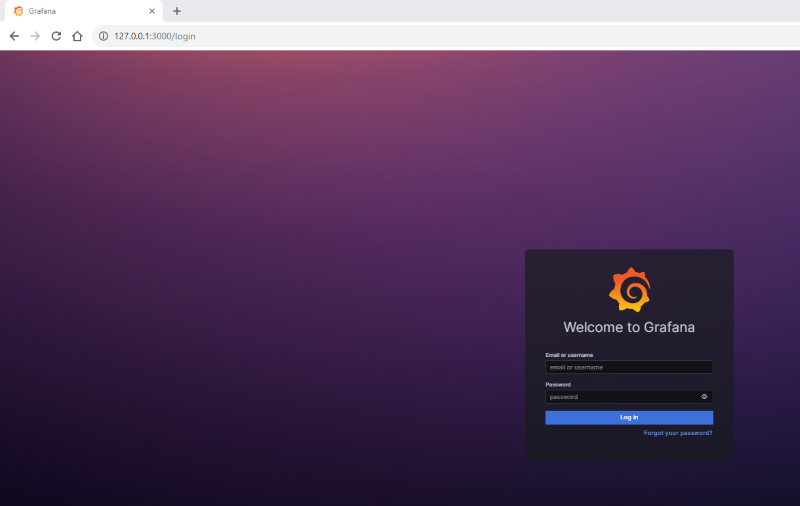
You will be redirected to the login page.
Use the default login credentials.
Enter the username = admin and password = admin.
Figure 1. Grafana® Login Page
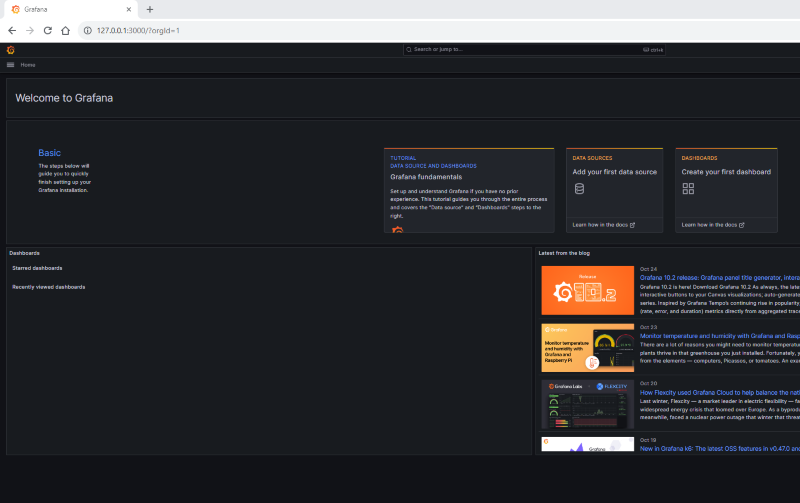
After successful registration the website will look as follows:
Figure 2. Grafana® Page
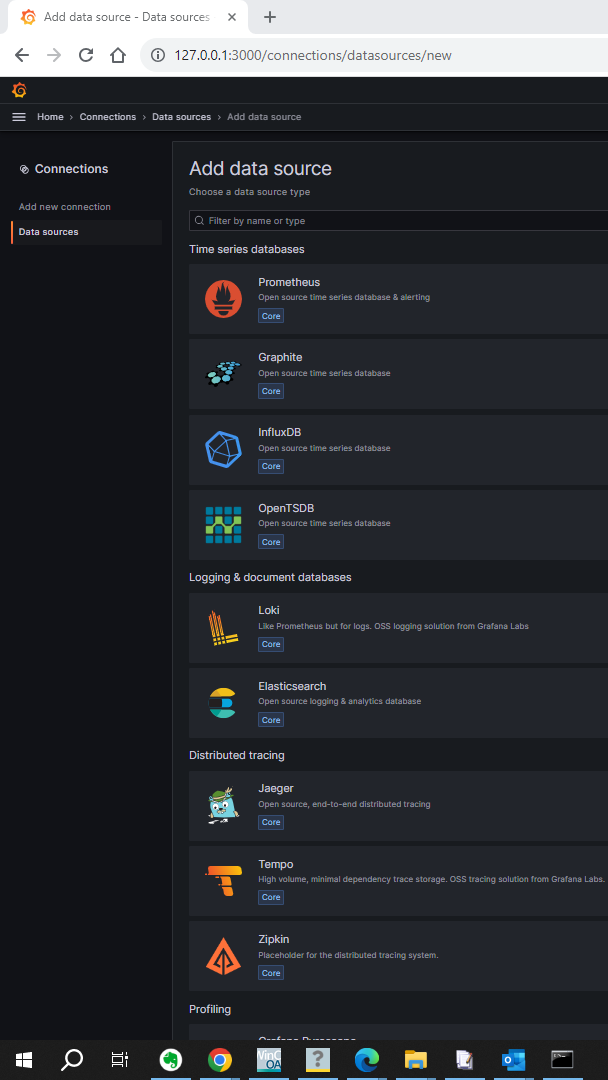
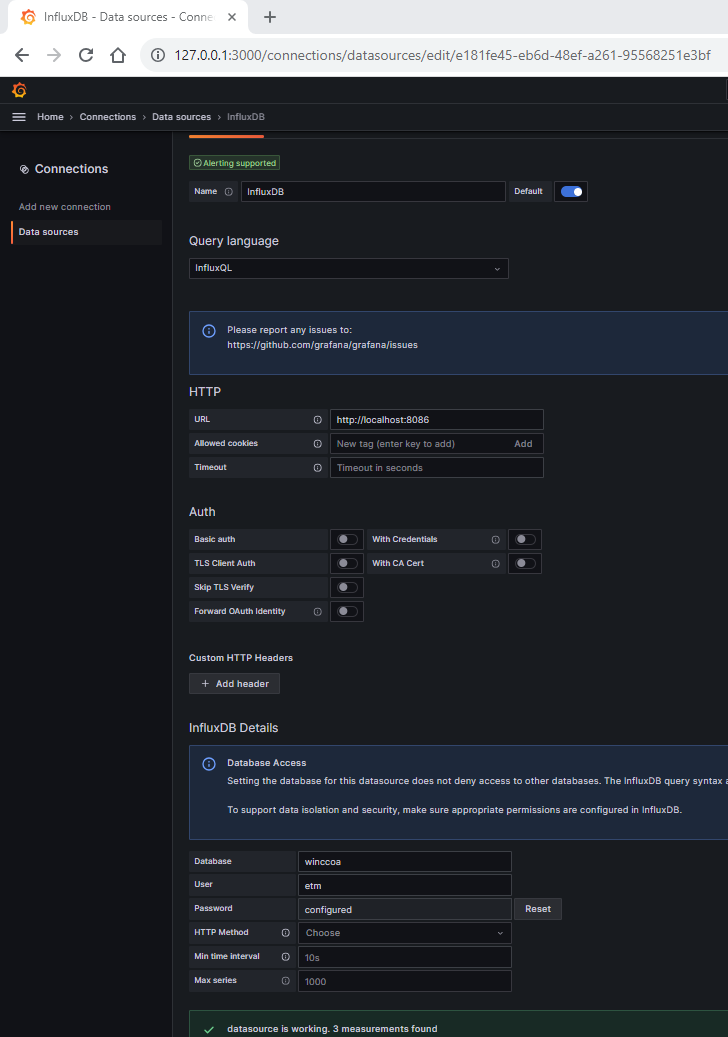
Add a data source
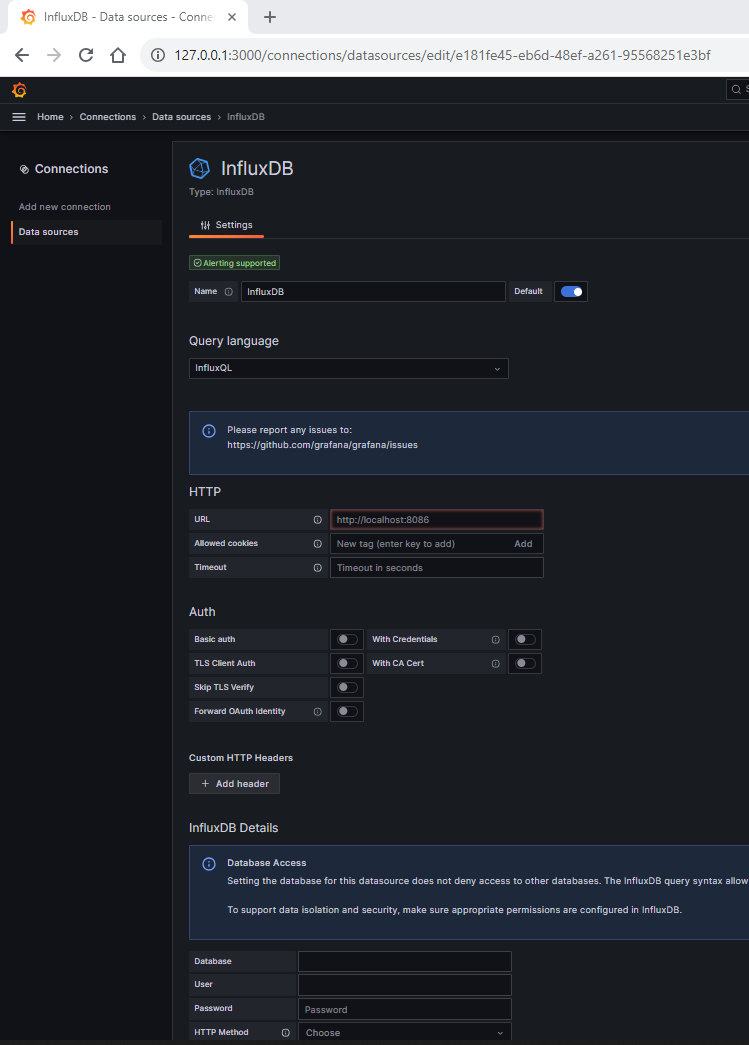
Before you can import or create your first dashboard, you must add InfluxDB® as a data source.
To access the data source settings, hover over the configuration icon (gear) and click Data Source. The Data Sources page opens and
shows a list of the previously configured data sources for the Grafana® instance.