Problem with curveValues

Discussions about product bugs & problems!
Note: This is no replacement for the Official ETM Support!
6 posts • Page 1 of 1
sergey.gromov
Posts:6
Joined: Thu Jan 19, 2017 2:20 pm

Problem with curveValues

Post by sergey.gromov »

Hello, all.

I want to set 3 arrays of values to trend. Each array contains 25000 values.

Image

[spoiler]

Code: Select all

main()
{
   //values for set to trend
   dyn_time  tt;
   dyn_float ff;
   dyn_bit64 bb;
   
   const int TR_COUNT  = 25000;  //dynlen values block
   const int TR_COUNT2 = 24999;
   const int TR_CIRCLE = 3;      //number of cycles (blocks)
   

   int frame = TR_COUNT;
   
   time tStart = getCurrentTime(); 
   tStart -= 10;   


   for (int blockNumber = 1; blockNumber = (frame-TR_COUNT2); i--)
      {
         dynAppend(tt, tStart-i);
         dynAppend(ff, 10.2*sin(i));
         dynAppend(bb, "1000001100000000000000000000000000000000001100000000000100000001");
      }
   
      DebugN("Set values to trend", "values block ?" +blockNumber, "dynlen values block:" + dynlen(ff));
      //set data to trend
      TREND1.curveValues("#1_1", ff, tt, bb);
      
      frame += TR_COUNT;
      TREND1.updatesEnabled(true);
   }
   time tEnd = tStart - 85000;
   setValue("TREND1", "visibleTimeRange", 0, tEnd, tStart+3600);

   //Get values from trend
   dyn_float df;
   dyn_time dt;
   dyn_bit64 db;
   getValue("TREND1","curveValues", "#1_1", df, dt, db);
   
   DebugN("Get values from trend", "dynlen values:" + dynlen(df));
   
}

[/spoiler]

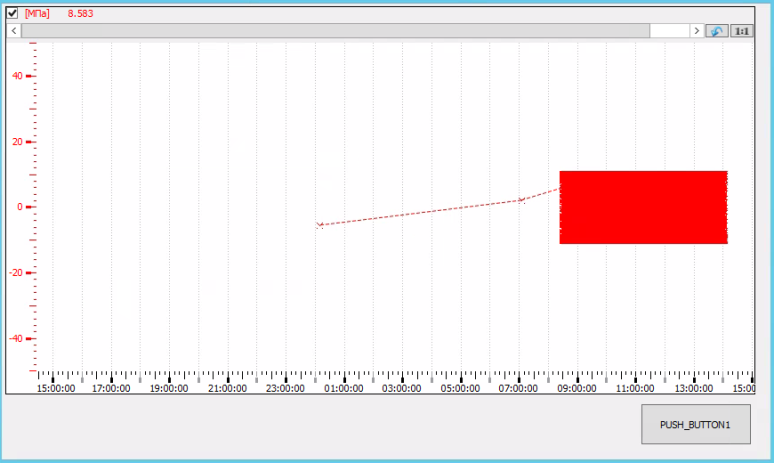
3 arrays of values are formed by clicking on the button (each array contains 25 000 values) and set on the trend widget with the function "curveValues".

The values of the first array are partially displayed on visible time range of trend.
The values of the second and third array of values are outside visible time range of trend.

After setValue() on the trend, the first array is truncated to 20,000 values, and the second and third arrays are set as one point.
Instead of 75000 points that set on the widget, 20002 points are displayed and 55000 points are lost.


Why are values lost when there are more than 20,000 values on a trend?
Attachments
screen1.png

mkoller
Posts:741
Joined: Fri Sep 17, 2010 9:03 am

Re: Problem with curveValues

Post by mkoller »

with which version ?

sergey.gromov
Posts:6
Joined: Thu Jan 19, 2017 2:20 pm

Re: Problem with curveValues

Post by sergey.gromov »

3.14 patch 16

mkoller
Posts:741
Joined: Fri Sep 17, 2010 9:03 am

Re: Problem with curveValues

Post by mkoller »

I can not reproduce your problem. See my testpanel attached. https://www.winccoa.com/fileadmin/image ... fTrend.pnl
Attachments
refTrend.pnl
(2.41 KiB) Downloaded 143 times

sergey.gromov
Posts:6
Joined: Thu Jan 19, 2017 2:20 pm

Re: Problem with curveValues

Post by sergey.gromov »

If set values on visible time range - everything is fine. The problem manifests itself, if I set values that go beyond the displayed time interval.

https://www.winccoa.com/fileadmin/image ... d_test.pnl
Attachments
trend_test.pnl
(3.1 KiB) Downloaded 132 times

mkoller
Posts:741
Joined: Fri Sep 17, 2010 9:03 am

Re: Problem with curveValues

Post by mkoller »

Your problem is this: setValue("TREND1", "visibleTimeRange", 0, tEnd, tStart+3600);
You fill data for today, then you tell the trend to jump back in time. With that, the trend removes values no longer needed (if count > 20000, to reduce memory), since
it assumes it can get the data again when you scroll back to the current time (which in your panel can't be done since you don't have DPs connected, so you would
need to implement the "refill" in the TimeScroll event)

6 posts • Page 1 of 1