Discussion about recent product features & solutions!
3 posts • Page 1 of 1
3 posts
• Page 1 of 1
bhavna
Posts:37
Joined: Mon Dec 20, 2010 1:12 pm
Plotting and fitting
Postby bhavna »
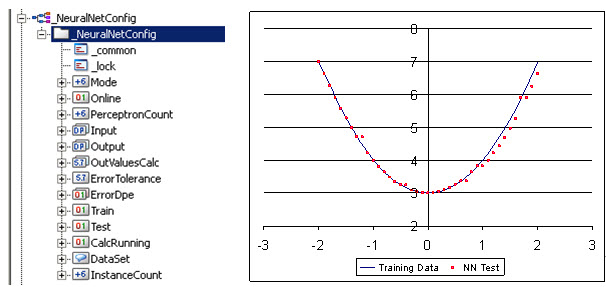
How can I plot data points in WinCC OA 3.11 and fit a curve on it ? (something similar to the image attached). The attached image has been taken from the ETM potal->Lab ->Prototype->Neural Network Manager section.
you can use the trend function "curveValues" and "curveValuessX" to set values for a curve in a x-y-trend.
The list of all functions can be found in the online help: CONTROL --> Control graphics --> Trend functions.
In WinCC OA it is not possible to display the vertical scale in centered position. It can be placed on the left or right side of the trend area.
Best Regards
Leopold Knipp
Senior Support Specialist